Overview
Bearish Inverted Cup and Handle
Also known as: Inverted Cup and Handle, Reverse Cup and Handle, Cup and Handle Top
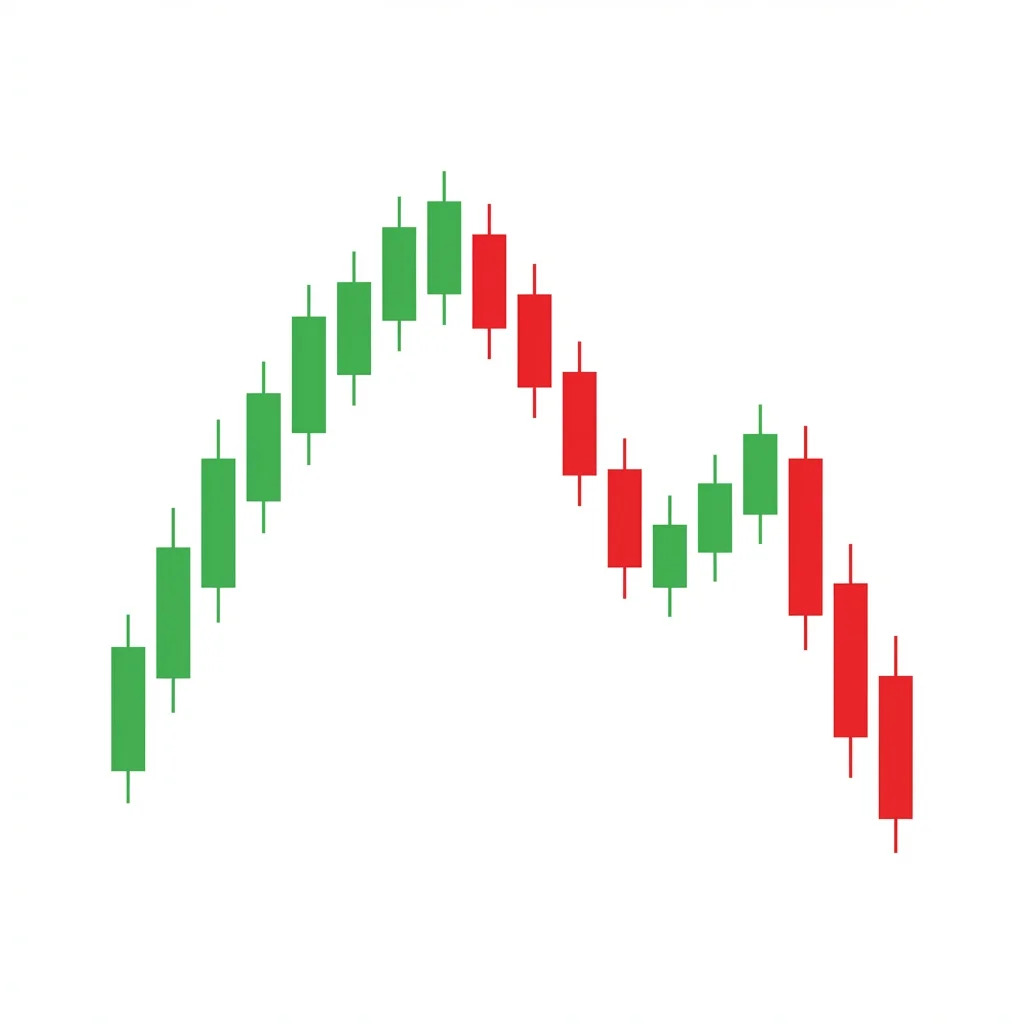
The inverted cup and handle is a bearish reversal pattern featuring a rounded top (inverted cup) followed by a brief upward consolidation (handle) before a breakdown, mirroring the bullish cup and handle pattern in reverse.
The inverted cup and handle is the bearish counterpart of the well-known bullish cup and handle pattern. It forms when a gradual, rounded top (the inverted cup) is followed by a small upward consolidation (the handle) before price breaks down. The rounded nature of the top indicates a gradual shift from buying to selling pressure, rather than a sharp reversal. The handle represents the last gasp of buying before sellers take definitive control. The measured move target equals the depth of the cup projected downward from the handle's breakdown point.
History & Etymology
The cup and handle pattern was popularized by William O'Neil in his book 'How to Make Money in Stocks' (1988). The inverted version was later identified by technicians as the bearish mirror image. While O'Neil focused on the bullish version for growth stock selection, traders recognized that the inverse pattern signaled major distribution and reversal.
The pattern is named for its visual resemblance to an upside-down cup with a small handle. When you invert the classic cup and handle, the rounded bottom becomes a rounded top (the cup) and the flag-like consolidation becomes the handle.
How It Forms
Formation Steps
- 1Rounded top forming an inverted U shape (the cup)
- 2Price declines from the left rim to the bottom of the cup
- 3Price rallies back up to approximately the right rim level
- 4Small upward consolidation or slight rally (the handle)
- 5Breakdown below the handle's low and the cup's support
Prerequisites
- Prior uptrend leading into the rounded top
- Rounded top formation taking at least 2-4 weeks
Confirmation Signals
- Break below the handle's support with increased volume
- Price closes below the lowest point of the handle
- Volume expansion on the breakdown
Invalidation Signals
- Price breaks above the cup's rim (the highest points)
- Handle rallies beyond 50% of the cup's depth
- Strong bullish volume during the handle formation
Candle Breakdown
Left Rim
The initial high point where the uptrend stalls and the rounding begins.
The last area of strong buying. From here, selling gradually increases.
Cup Bottom (Top of Dome)
The area where price gradually declines in a rounded fashion, forming the dome of the inverted cup.
Gradual distribution. Neither bulls nor bears are aggressive — the transition is smooth and orderly.
Handle Formation
A brief, small upward consolidation that occurs near the right rim of the cup.
Last attempt by buyers to rally. Volume dries up, showing conviction is gone.
Breakdown
Price breaks below the handle's support with expanding volume.
Sellers break through the final support. Remaining longs capitulate.
Psychology
The inverted cup and handle represents a gradual but relentless shift from bullish to bearish sentiment. The rounded top shows the smooth transfer of ownership from strong hands to weak hands, culminating in a breakdown.
Buyer Perspective
Buyers gradually lose conviction as the rounding top forms. Each rally attempt within the cup is weaker. The handle provides false hope before the final collapse.
Seller Perspective
Sellers patiently distribute throughout the cup formation. The gradual rounding allows them to sell without creating panic. The handle breakdown is the signal that distribution is complete.
Smart Money Action
Institutions use the gradual rounding to distribute large positions over weeks without significantly impacting price. The rounded top is the signature of patient, professional selling.
Retail Trader Trap
Retail traders view the rounding as consolidation and the handle as a buying opportunity. They enter long during the handle, only to be trapped by the breakdown.
Emotional Cycle
Trading Strategy
Aggressive Entry
Short when the handle begins to break support, before the full breakdown is confirmed.
Conservative Entry
Wait for a confirmed close below the handle's low with above-average volume.
Cup depth projected downward from the handle's breakdown point.
1.5x the cup depth.
Major support level below.
Best Conditions
- Timeframe: daily
- Timeframe: weekly
- Timeframe: 4h
- end of bull market
- sector distribution
- rising interest rates
- Asset: stocks
- Asset: indices
- Asset: crypto
Avoid When
- Timeframe: 1m
- Timeframe: 5m
- Timeframe: 15m
- strong bull market
- QE environment
Confluence Factors
- Cup forms at a major resistance level
- Volume profile shows distribution throughout the cup
- RSI bearish divergence from rim to rim
- MACD declining throughout the cup formation
- Sector or market showing similar weakness
Scale In Strategy
Enter 50% on handle breakdown, add 50% on a retest of the handle that fails.
Scale Out Strategy
Take 33% at half the measured move, 33% at the full measured move, trail remaining.
Risk Management
Volume Analysis
Volume Confirmation
Volume should decline during the cup's formation and handle, then expand on the breakdown.
Volume Profile
The handle area should show a low-volume node, confirming weak participation in the final rally attempt.
Volume Divergence
Increasing volume during the handle rally is a warning — the pattern may fail.
Technical Confluence
Support Resistance
The cup's rim becomes resistance. The handle's low is the trigger support. Once broken, the handle zone becomes resistance.
Fibonacci Levels
The cup's depth often aligns with Fibonacci levels of the prior uptrend. The measured move target may coincide with the 61.8% retracement.
Moving Averages
The 50 SMA often tracks through the middle of the cup, acting as dynamic resistance during the right side of the formation.
Rsi Confirmation
RSI declining from above 70 to below 50 during the cup formation confirms progressive weakening.
Macd Confirmation
MACD making lower highs while the cup forms shows declining momentum beneath the surface.
Bollinger Bands
Bands contracting during the handle confirms low volatility before the expansion on the breakdown.
Vwap
Anchored VWAP from the cup's rim should slope downward, confirming the distribution.
Ichimoku Cloud
Price breaking below the Kumo cloud during or after the handle breakdown is extremely bearish.
Elliott Wave
The inverted cup often forms as a complex Wave B or the end of Wave 5, preceding a significant correction.
Wyckoff Phase
The inverted cup and handle maps to the distribution schematic: the cup is distribution, the handle is the last point of supply, and the breakdown is the sign of weakness.
Market Profile
The cup shows a slowly migrating value area. The handle forms a brief balance before the breakdown.
Order Flow
Gradual increase in passive selling throughout the cup formation. The handle shows exhaustion of buying.
Open Interest
Increasing put open interest during the cup formation confirms institutional hedging.
Multi-Timeframe Analysis
Higher Timeframe Alignment
An inverted cup and handle on the weekly chart signals a major reversal. Monthly chart formations can mark secular trend changes.
Lower Timeframe Entry
Use the 4H chart to time the handle breakdown precisely and identify rejection patterns within the handle.
Timeframe Confluence
Cup visible on the weekly and the handle on the daily provides the best confluence.
Top-Down Approach
Monthly distribution → Weekly inverted cup → Daily handle → 4H breakdown entry.
Statistics
Historical Examples
PayPal Inverted Cup and Handle
successPayPal formed an inverted cup and handle over several months starting from its $310 high. The handle formed near $270, and the breakdown led to a decline below $100 over the following year.
Lesson: Inverted cup and handle patterns in former market leaders can signal massive trend reversals, often exceeding the measured move.
Gold Inverted Cup and Handle 2020
successGold formed an inverted cup and handle after reaching its all-time high above $2070. The handle formed near $2000 before a breakdown led to a decline to $1680.
Lesson: Commodities can form clean inverted cup and handle patterns at major cycle highs.
Variations
Short Handle Variant
Handle lasts only 2-5 candles, showing minimal buying interest.
Deep Handle Variant
Handle retraces 30-50% of the cup's depth.
Confusion Matrix
Patterns commonly confused with Bearish Inverted Cup and Handle and how to distinguish them.
Bearish Rounding Top
80% similarCheck for the handle: a brief upward consolidation after the rounded top. Without the handle, it is a simple rounding top.
Key Differences
- Inverted cup and handle has a distinct handle; rounding top does not
- The handle provides a specific entry trigger
- Inverted C&H has a more defined measured move calculation
Bearish Head Shoulders
50% similarThe curvature is the key: a smooth, rounded top is an inverted cup. Three distinct peaks with a neckline is a head and shoulders.
Key Differences
- H&S has three distinct peaks; inverted C&H has a smooth dome
- H&S has a straight neckline; inverted C&H has a curved profile
- H&S typically forms faster than the gradual inverted cup
The Distribution phase is a Wyckoff concept where institutional investors systematically sell (distribute) their holdings to the public within a trading range at a market top, before the subsequent markdown (decline) begins.
The Double Top is an M-shaped reversal pattern where price tests a resistance level twice and fails, creating two peaks at similar levels. The breakdown below the neckline (trough between peaks) confirms the reversal with a measured move target equal to the pattern height.
The Bearish Engulfing is one of the most powerful and commonly traded two-candle reversal patterns. A large bearish candle completely engulfs the prior bullish candle, demonstrating a decisive shift from buying to selling dominance.
The head and shoulders is the most well-known reversal pattern in technical analysis. It consists of three peaks — a higher middle peak (head) flanked by two lower peaks (shoulders) — and signals a major bearish reversal when the neckline breaks.
The rounding top is a gradual reversal pattern shaped like an inverted saucer. Price slowly transitions from an uptrend to a downtrend in a smooth arc, with volume declining at the peak and expanding on the neckline breakdown.
The Cup and Handle is one of the most reliable continuation patterns in technical analysis, featuring a rounded U-shaped base (cup) followed by a small pullback (handle) before a powerful breakout to new highs.
Pro Tips & Common Mistakes
Pro Tips
- The smoother and more symmetrical the cup, the more reliable the pattern.
- The handle should retrace no more than one-third of the cup's depth — a deeper handle weakens the pattern.
- Volume declining throughout the cup and handle, then expanding on the breakdown, is the ideal signature.
- Compare the left and right rims: the right rim at or slightly below the left rim is ideal.
Common Mistakes
- Confusing a rounding top with an inverted cup and handle — the handle is a critical component.
- Entering before the handle breaks — the handle may rally and invalidate the setup.
- Not measuring the cup depth correctly for the target — measure from the rim to the deepest point.
- Trading this pattern on timeframes below 4H where the formation is unreliable.
Advanced Techniques
- Use volume profile analysis across the entire cup to identify the area of heaviest distribution.
- Combine with institutional ownership data: declining institutional holdings during the cup formation confirm distribution.
- Monitor options flow for protective put buying during the handle — this confirms smart money preparing for the breakdown.
- Use relative strength analysis: if the asset is underperforming its sector during the handle, the breakdown is more likely.
Institutional Perspective
The gradual rounding of the inverted cup is the hallmark of patient institutional distribution. Large funds cannot sell all at once, so they distribute over weeks, creating the smooth curvature. The handle is the last phase of selling before the position is fully unwound.
Fun Facts
- William O'Neil, who popularized the bullish cup and handle, once said the inverted version was 'the most dangerous pattern for longs.'
- The inverted cup and handle formed on the NASDAQ composite chart before the dot-com bust in 2000.
- The pattern's gradual nature makes it one of the hardest bearish patterns to spot in real-time — most traders only see it in hindsight.
Frequently Asked Questions
An inverted cup and handle is a bearish reversal pattern featuring a rounded top (inverted cup) followed by a brief upward consolidation (handle). The breakdown below the handle signals a major trend reversal with a target equal to the cup's depth.
The inverted cup typically forms over 3-8 weeks, and the handle adds another 1-2 weeks. The total formation can span 1-3 months on a daily chart.
Measure the vertical distance from the cup's rim to the deepest point of the cup. Project that distance downward from the handle's breakdown point. This is the measured move target.