Overview
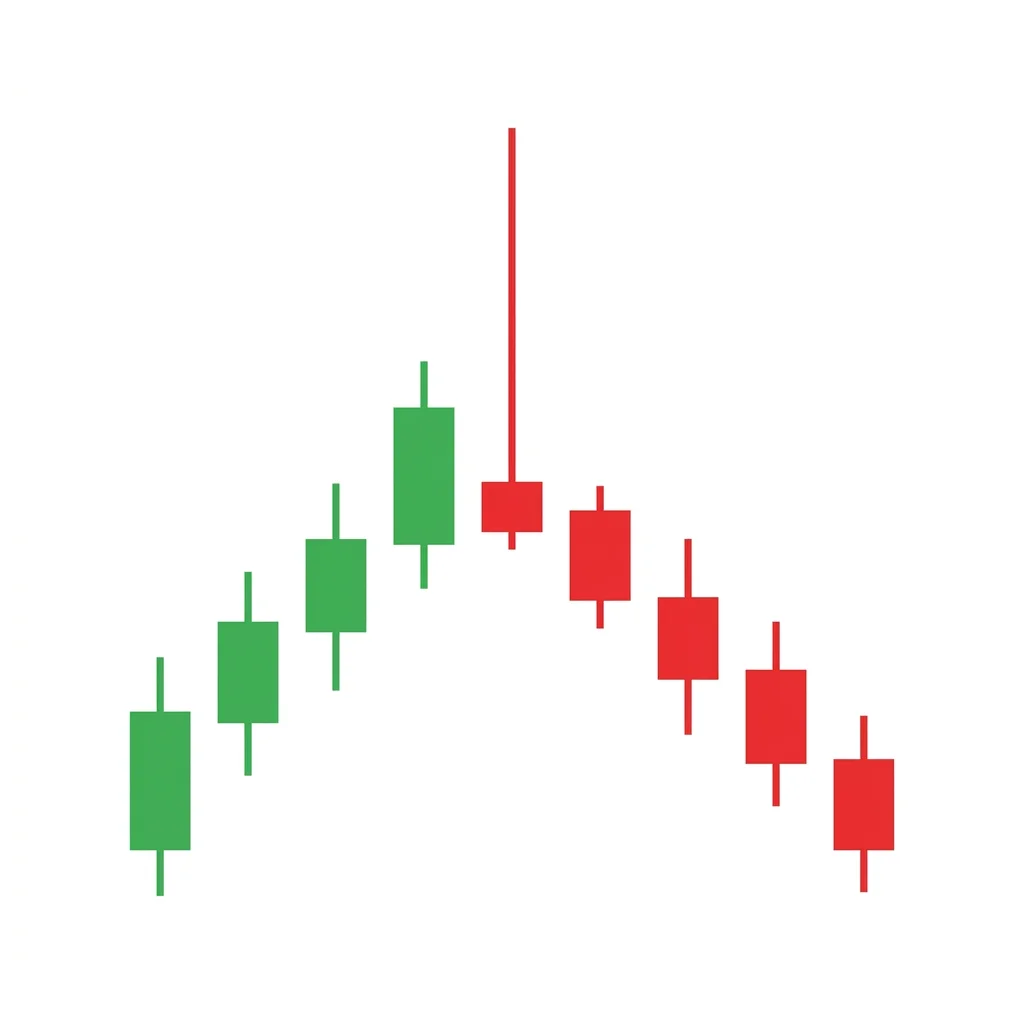
Bearish Long Upper Shadow
Also known as: Long Wick Rejection, Upper Shadow Candle, Pin Bar Top
A candle with a long upper shadow (at least 2-3x the body) indicates that price rallied significantly during the session but was rejected, closing near the low. It signals selling pressure and potential reversal at the top of rallies.
The long upper shadow is one of the simplest yet most effective bearish signals. During the session, buyers push price significantly higher, but by the close, sellers have driven it back down near the open or low. The long upper shadow represents a failed auction above — price explored higher levels but found no acceptance. This is a broad category that encompasses shooting stars, gravestone dojis, and other patterns with prominent upper wicks. The pattern is most meaningful at resistance levels, after extended rallies, or when accompanied by high volume.
History & Etymology
Upper shadow analysis has been part of Japanese candlestick trading since the 18th century. The shadow (kage) was considered as important as the body (jittai) by early Japanese analysts. Western bar chart traders recognized the same concept, calling it a 'rejection' at higher prices.
The 'shadow' (or 'wick') is the thin line extending above the body. 'Long' indicates the shadow is disproportionately large relative to the body. The shadow represents the range that was explored but rejected during the session.
How It Forms
Formation Steps
- 1Candle with an upper shadow at least 2-3x the body length
- 2Body can be bullish or bearish, typically near the low
- 3Lower shadow is short or absent
- 4Appears at the top of a rally or at resistance
Prerequisites
- Prior uptrend or rally
- Preferably at a resistance level
Confirmation Signals
- Bearish candle following the long upper shadow
- Volume spike on the long shadow candle
- Close near the low of the range
Invalidation Signals
- Strong bullish candle breaking above the shadow's high
- No follow-through selling
- Shadow candle on very low volume
Candle Breakdown
Long Upper Shadow Candle
A candle with an upper shadow at least 2-3x the body length. The body sits near the low of the range.
Buyers rallied price significantly higher during the session but sellers overpowered them, pushing the close back near the open/low.
Psychology
The long upper shadow tells a story of failed buying. Price explored higher levels but was rejected, showing that sellers are active and aggressive at elevated prices.
Buyer Perspective
Buyers pushed price higher during the session but could not maintain the gains. Their intraday profits evaporated, creating frustration and doubt.
Seller Perspective
Sellers demonstrated their ability to reject higher prices. The long shadow emboldens them to press further.
Smart Money Action
Institutions sell into the intraday rally, creating the upper shadow. The rejection at higher prices is the visible result of institutional distribution.
Retail Trader Trap
Retail traders buy during the intraday high, only to see gains evaporate by the close.
Emotional Cycle
Trading Strategy
Aggressive Entry
Short on the next candle's open if the long shadow candle closes in the bottom 25% of its range.
Conservative Entry
Wait for a bearish confirmation candle that closes below the shadow candle's low.
Shadow length projected downward from the body.
Next support level.
Prior swing low.
Best Conditions
- Timeframe: daily
- Timeframe: 4h
- Timeframe: 1h
- Timeframe: weekly
- at resistance
- overbought
- end of rally
- Asset: stocks
- Asset: forex
- Asset: indices
- Asset: crypto
Avoid When
- Timeframe: 1m
- Timeframe: 5m
- strong uptrend
- breakout
Confluence Factors
- At a key resistance level
- RSI above 70
- MACD divergence
- Fibonacci level
- High volume
Scale In Strategy
Enter 50% on confirmation, 50% on break below the shadow candle's low.
Scale Out Strategy
Take 50% at TP1, trail remainder.
Risk Management
Volume Analysis
Volume Confirmation
High volume on the long shadow candle confirms institutional rejection at higher prices.
Volume Profile
The upper shadow zone should show high volume that was rejected — a volume spike at prices that were not accepted.
Volume Divergence
Low volume on the shadow candle makes it less significant.
Technical Confluence
Support Resistance
The shadow high becomes a key resistance reference. Most powerful at pre-existing resistance.
Fibonacci Levels
Long upper shadow at a Fibonacci level confirms rejection.
Moving Averages
Shadow rejection at a moving average (50 or 200 SMA) is a strong signal.
Rsi Confirmation
RSI above 70 confirms overbought conditions at the shadow.
Macd Confirmation
MACD declining while the shadow forms shows divergence.
Bollinger Bands
Shadow piercing the upper band and closing inside is classic rejection.
Vwap
Shadow above VWAP closing back below confirms intraday rejection.
Ichimoku Cloud
Shadow rejection at the Kumo cloud edge is bearish.
Elliott Wave
Long upper shadows often mark the terminal point of impulse waves.
Wyckoff Phase
The shadow represents an upthrust in the distribution phase.
Market Profile
The shadow creates a buying tail excess that marks the session's rejected prices.
Order Flow
Aggressive selling absorbed the buying at the shadow high. Negative delta at the top.
Open Interest
Call OI at the shadow high may have acted as a ceiling.
Multi-Timeframe Analysis
Higher Timeframe Alignment
Weekly long upper shadows are very powerful reversal signals.
Lower Timeframe Entry
Use 1H to see the intraday reversal within the shadow for precise entry.
Timeframe Confluence
Long shadow on daily at weekly resistance is ideal.
Top-Down Approach
Weekly resistance → Daily long upper shadow → 4H rejection → Enter.
Statistics
Historical Examples
SPX Long Upper Shadow at ATH
successThe S&P 500 formed a candle with a very long upper shadow at its all-time high on the first trading day of 2022. The index declined over 25% in the following months.
Lesson: Long upper shadows at all-time highs with volume are powerful reversal signals.
Variations
Shooting Star
Specific long upper shadow with small body at the bottom, no lower shadow.
Gravestone Doji
Long upper shadow with open and close at the low (doji body).
Confusion Matrix
Patterns commonly confused with Bearish Long Upper Shadow and how to distinguish them.
Bearish Shooting Star
90% similarA shooting star is a specific type of long upper shadow candle with a small body at the bottom, minimal lower shadow, and uptrend context. Long upper shadow is the general category.
Key Differences
- Long upper shadow is a broader category
- Shooting star has specific body/shadow ratio requirements
- Shooting star requires uptrend context
The Dark Cloud Cover is a two-candle bearish reversal pattern where a bearish candle opens above the prior bullish candle's high and closes below its midpoint, signaling that the bullish 'sky' is being covered by a bearish 'dark cloud.'
The Bearish Engulfing is one of the most powerful and commonly traded two-candle reversal patterns. A large bearish candle completely engulfs the prior bullish candle, demonstrating a decisive shift from buying to selling dominance.
The gravestone doji is a single-candle reversal pattern with the open, close, and low at the same level and a long upper shadow, resembling a gravestone. It signals that buyers pushed price higher but sellers reclaimed all gains by the close.
The hanging man is a single-candle bearish reversal pattern with a small body at the top and a long lower shadow, appearing at the top of an uptrend. It warns that selling pressure is emerging despite the continued uptrend.
The shooting star is a single-candle bearish reversal pattern with a small body near the low and a long upper shadow. It shows that buyers pushed price significantly higher during the session but sellers drove it back down, signaling a potential top.
A candle with a long lower shadow signals that buyers aggressively rejected lower prices during the session, pushing price back up from the lows. This buying pressure suggests a potential bottom or support level.
Pro Tips & Common Mistakes
Pro Tips
- The longer the upper shadow relative to the body, the more bearish the signal.
- A bearish body (red/black) is slightly more bearish than a bullish body on a long shadow candle.
- High volume on the shadow candle is critical — low volume shadows are noise.
- The shadow's high becomes a key resistance level for future price action.
Common Mistakes
- Trading every long upper shadow without context — it needs to be at resistance or after a rally.
- Not requiring confirmation — long shadows can be brief pullbacks in strong trends.
- Ignoring volume — low volume long shadows are common and unreliable.
- Setting the stop too far above the shadow high.
Advanced Techniques
- Measure the shadow-to-body ratio: ratios above 3:1 are the most significant.
- Use volume profile to identify exactly where in the shadow the most volume traded — this is the strongest rejection level.
- Combine multiple long upper shadow candles at the same level for pattern confluence.
- Use delta analysis to see the exact selling absorption at the shadow high.
Institutional Perspective
Long upper shadows at resistance are the footprint of institutional selling. The intraday rally provides liquidity for distribution, and the close near the low confirms that selling exceeded buying.
Fun Facts
- In Japanese, the upper shadow is called 'uwakage' (上影), meaning 'upper shadow' — Japanese traders viewed shadows as equally important to bodies.
- Algorithmic trading systems frequently scan for long upper shadow candles at resistance as a primary reversal filter.
- The long upper shadow is the foundation concept for multiple named patterns: shooting star, gravestone doji, and hanging man variations.
Frequently Asked Questions
A long upper shadow indicates that price was pushed higher during the session but was rejected, closing near the low. It shows that sellers overwhelmed buyers at elevated prices.
The upper shadow should be at least 2-3 times the length of the body for the signal to be significant. The longer the shadow relative to the body, the stronger the rejection signal.