Overview
Bearish Side-by-Side White Lines
Narabi Aka
Also known as: Side-by-Side Lines Down, Bearish Parallel White Lines
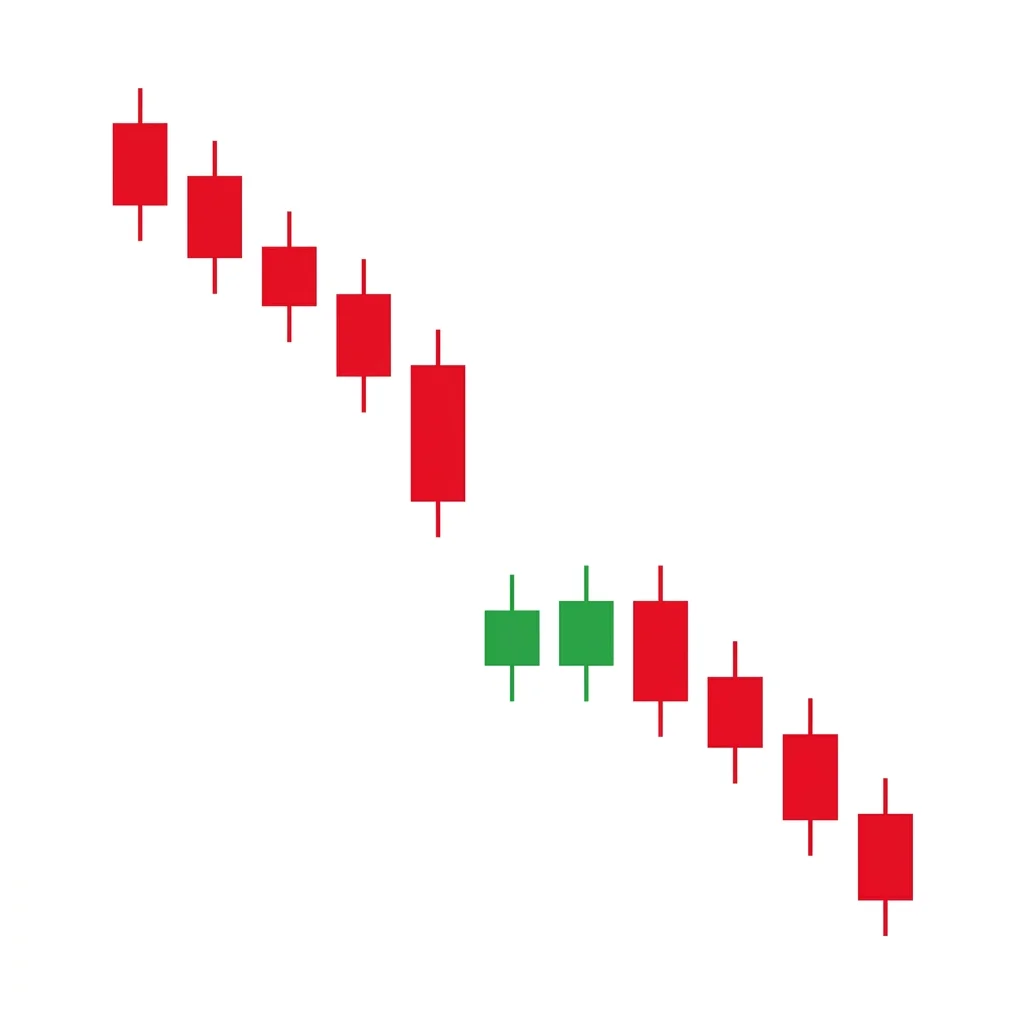
Bearish side-by-side white lines is a rare three-candle continuation pattern in a downtrend. A bearish candle is followed by two similar-sized bullish candles that gap down. Despite the bullish candles, the gap is not filled, signaling that sellers maintain control.
The bearish side-by-side white lines is one of the rarest candlestick patterns. It occurs during a downtrend when a bearish candle is followed by two consecutive bullish candles that gap down from the first candle. The key insight is that even though the second and third candles are bullish (white/green), they fail to fill the gap created by the downward move. The two bullish candles represent short-covering or minor buying interest that is insufficient to reverse the trend. Their similar size and parallel appearance create the 'side-by-side' visual. The pattern signals that the downtrend will continue because the attempted recovery (two bullish candles) could not even fill the gap, let alone reverse the trend.
History & Etymology
This pattern originates from Japanese candlestick analysis and is described in classic Japanese technical analysis texts. It was introduced to Western audiences through Steve Nison's works. Due to its rarity, it has less statistical data than more common patterns.
'Side-by-side' refers to the two bullish candles sitting next to each other with similar sizes and positions. 'White lines' is the traditional Japanese term for bullish candles (white body). The bearish context is what makes the bullish candles a continuation signal.
How It Forms
Formation Steps
- 1First candle is bearish (black/red), continuing the existing downtrend
- 2Second candle is bullish (white/green) but gaps down from the first candle's close
- 3Third candle is also bullish (white/green), similar in size to the second, opening near the second candle's open
- 4Despite two bullish candles, the downward gap is not filled
Prerequisites
- Established downtrend in progress
- Clear downward momentum
Confirmation Signals
- Fourth candle continues the downtrend below the third candle
- The gap between the first and second candle remains unfilled
- Volume declines on the two bullish candles
Invalidation Signals
- Price rallies above the first candle's close, filling the gap
- Strong bullish momentum on the third or fourth candle
- Volume increases on the bullish candles
Candle Breakdown
Bearish Trend Candle
A bearish candle that continues the established downtrend, setting up the pattern.
Sellers maintain control, pushing price lower with conviction.
First White Line
A bullish candle that gaps down from the first candle's close. Despite being bullish, it opens well below the prior candle.
Minor buying interest or short-covering creates a small bullish candle, but the gap down shows that sellers drove price significantly lower before buyers appeared.
Second White Line
Another bullish candle similar in size and position to the second, opening near the second candle's open. Still fails to fill the gap.
A second attempt to rally fails to gain traction. The inability to fill the gap after two bullish candles confirms that buying interest is weak.
Psychology
The pattern reveals that even when buyers attempt a recovery (two bullish candles), their efforts are insufficient to fill the downward gap. This impotence of buying pressure in the face of a clear downtrend signals continuation.
Buyer Perspective
Buyers attempt to recover after the gap down but cannot muster enough strength to fill the gap. Two consecutive failed rally attempts demoralize remaining bulls.
Seller Perspective
Sellers see the two bullish candles as weak and insignificant—the gap remains unfilled, confirming that selling pressure dominates. They prepare to push price lower once the minor buying exhausts itself.
Smart Money Action
Smart money allows minor short-covering to occur (creating the bullish candles) but defends the gap level, preventing any meaningful recovery.
Retail Trader Trap
Retail traders see two bullish candles and believe a reversal is forming, only to watch the downtrend resume.
Emotional Cycle
Trading Strategy
Aggressive Entry
Enter short at the close of the third candle, anticipating the downtrend resumption.
Conservative Entry
Wait for the fourth candle to close below the third candle's low before entering short.
Previous swing low
Measured move equal to the gap plus the first candle's range
Next major support level
Best Conditions
- Timeframe: 1D
- Timeframe: 4h
- Strong downtrends
- Bear markets
- Asset: Stocks
- Asset: Indices
Avoid When
- Timeframe: 1m
- Timeframe: 5m
- Sideways markets
- Near strong support
Confluence Factors
- Pattern occurs in a clear downtrend
- Volume declining on the bullish candles
- Gap remains unfilled
- Moving averages sloping downward
- RSI below 50
Scale In Strategy
Enter on the fourth candle and add on any weak bounce.
Scale Out Strategy
Take 50% at the previous swing low, trail the rest.
Risk Management
Volume Analysis
Volume Confirmation
Volume should be lower on the two bullish candles than on the bearish candle, confirming weak buying interest.
Volume Profile
Declining volume on the white lines indicates exhaustion of short-term buying.
Volume Divergence
Increasing volume on the bullish candles may suggest a genuine reversal attempt.
Technical Confluence
Support Resistance
The unfilled gap becomes a resistance zone overhead. Previous swing lows become targets.
Fibonacci Levels
The two bullish candles often represent a 23.6-38.2% retracement of the prior decline—shallow and insignificant.
Moving Averages
The pattern is most reliable when all major moving averages are above price and sloping downward.
Rsi Confirmation
RSI remaining below 50 during the bullish candles confirms weak buying momentum.
Macd Confirmation
MACD below zero and the signal line confirms the bearish environment.
Bollinger Bands
Price near the lower Bollinger Band with the bullish candles failing to reach the middle band confirms weakness.
Vwap
Price remaining below VWAP during the bullish candles confirms institutional selling.
Ichimoku Cloud
Pattern below the Kumo cloud confirms the bearish environment.
Elliott Wave
May appear during minor corrections within Wave 3 or Wave 5 bearish impulses.
Wyckoff Phase
Can appear during brief pauses in the markdown phase.
Market Profile
The gap creates a low-volume zone that acts as resistance.
Order Flow
Minimal buying pressure visible in the order flow during the white lines.
Open Interest
Monitor open interest changes for additional confirmation of institutional participation in the move.
Multi-Timeframe Analysis
Higher Timeframe Alignment
A daily pattern is strongest when the weekly chart confirms the downtrend.
Lower Timeframe Entry
Use the 4H chart to confirm that the gap remains unfilled and the downtrend is resuming.
Timeframe Confluence
Daily pattern within a weekly downtrend provides the best context.
Top-Down Approach
Weekly downtrend > Daily side-by-side white lines > 4H continuation confirmation.
Statistics
Historical Examples
Toyota Side-by-Side White Lines
successToyota formed side-by-side white lines during a downtrend with a gap down followed by two small bullish candles. The downtrend resumed with a 5% decline over the next week.
Lesson: The pattern works best in high-volume stocks with clear gap behavior.
Variations
Near Side-by-Side Lines
The two bullish candles are close in size and position but not exactly matching.
Confusion Matrix
Patterns commonly confused with Bearish Side-by-Side White Lines and how to distinguish them.
Bearish Downside Tasuki Gap
7500% similarCount the bullish candles after the gap. One = tasuki gap. Two similar-sized = side-by-side white lines.
Key Differences
- Tasuki gap has one bullish candle in the gap; side-by-side has two
- Tasuki gap candle partially fills the gap; side-by-side lines do not
- Side-by-side lines require two similar-sized bullish candles
The Downside Tasuki Gap is a bearish continuation pattern in a downtrend where a gap-down is partially but not completely filled by a bullish candle, suggesting that the downtrend will continue as the gap acts as resistance.
A falling window is a Japanese candlestick term for a gap down in price where the high of the current candle is below the low of the previous candle, signaling strong bearish continuation momentum.
Bullish Side-by-Side White Lines is a three-candle continuation pattern where a bullish candle gaps up and is followed by two similar-sized bullish candles at the same level, confirming the uptrend's strength.
The Bearish Abandoned Baby is one of the rarest and most reliable top reversal patterns in candlestick analysis. It features a doji that is completely isolated by gaps on both sides, signaling an abrupt and dramatic shift from buying to selling pressure.
The Bearish Advance Block shows three consecutive bullish candles with progressively smaller bodies and longer upper shadows, signaling that buying momentum is weakening and a reversal or consolidation is likely.
The Deliberation pattern shows two strong bullish candles followed by a small-bodied third candle, indicating that the uptrend is 'deliberating' — the bulls have stalled and are uncertain about pushing higher.
Pro Tips & Common Mistakes
Pro Tips
- This is an extremely rare pattern—do not force identification where it does not clearly exist.
- The two white lines must be similar in size and position—if they are very different, the pattern is not valid.
- The gap must remain unfilled; if either bullish candle fills the gap, the pattern is invalidated.
- Due to its rarity, always combine this pattern with other bearish signals before trading.
- The pattern is most commonly found in Japanese equities, where gap behavior is more pronounced.
Common Mistakes
- Forcing the pattern identification when the candles do not clearly match
- Trading the pattern in markets that rarely gap (24/7 markets)
- Not requiring the gap to remain unfilled
- Over-weighting a rare, moderate-reliability pattern
- Ignoring volume analysis on the white lines
Advanced Techniques
- Compare the combined range of the two white lines to the bearish candle—if the white lines are significantly smaller, the bearish pressure is dominant.
- Use the midpoint of the gap as a key level—if the white lines do not reach it, the gap strength is confirmed.
- In Japanese markets, combine with the previous session's settlement price for additional context.
- Track this pattern as part of a gap analysis framework rather than as a standalone signal.
Institutional Perspective
The unfilled gap shows that institutional selling pressure has created a price vacuum. The two bullish candles represent minor retail or short-covering interest that is insufficient to challenge the institutional selling.
Fun Facts
- This is one of the rarest candlestick patterns, appearing perhaps once per year in a given stock on a daily chart.
- The pattern is far more common in Japanese markets, where overnight gaps are a regular occurrence.
- Some automated pattern recognition systems do not even include this pattern due to its extreme rarity.
Frequently Asked Questions
A rare three-candle continuation pattern: a bearish candle followed by two similar-sized bullish candles that gap down. Despite being bullish, the two candles fail to fill the gap, confirming the downtrend will continue.
The key is context: the two bullish candles appear after a gap down and fail to fill the gap. Their inability to recover the lost ground, despite two attempts, confirms that buying pressure is too weak to reverse the trend.