Overview
Bearish Tri-Star
Sansei Boshi
Also known as: Triple Star Bearish, Three Doji Stars, Tri-Star Doji Top
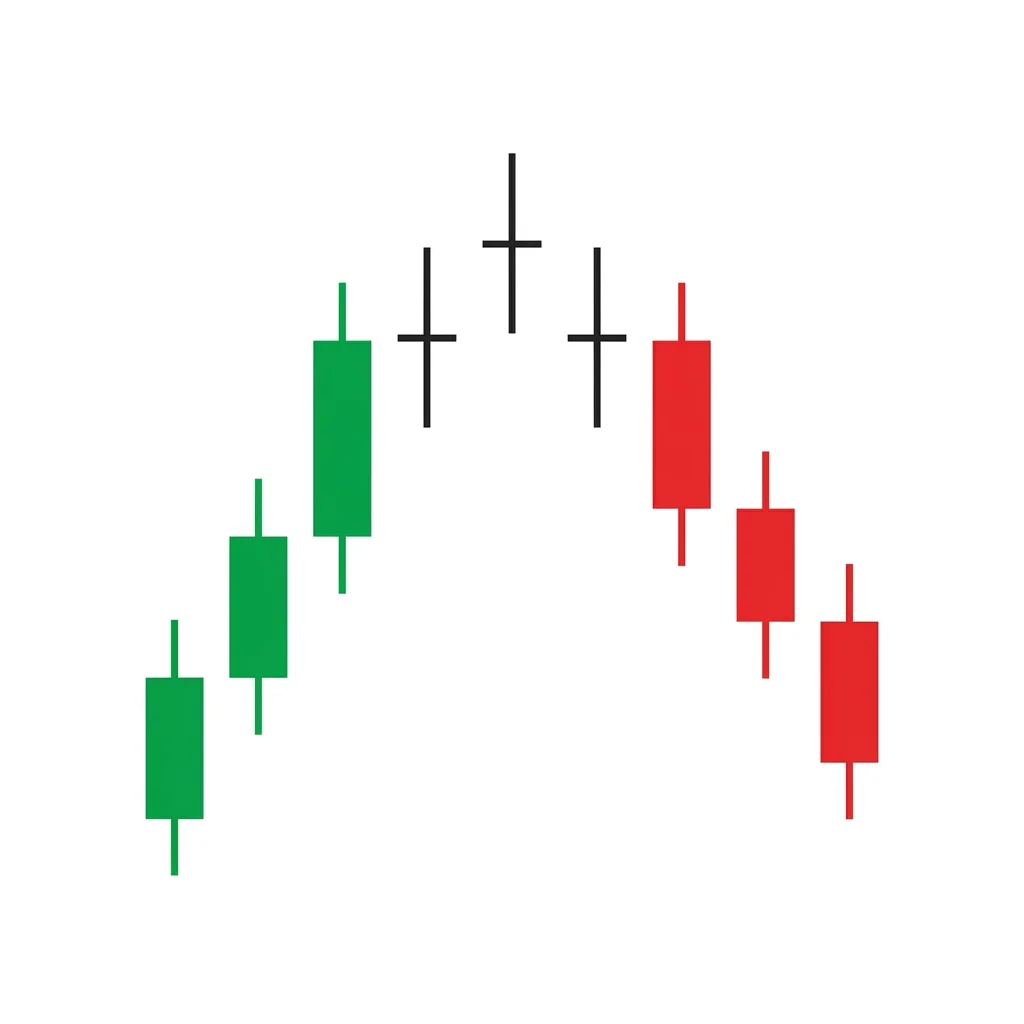
The bearish tri-star is an extremely rare and powerful reversal pattern consisting of three consecutive doji candles, with the middle doji gapping higher. Three sessions of complete indecision at the top of an uptrend signal that buying momentum has evaporated.
The bearish tri-star is one of the rarest patterns in candlestick analysis. It consists of three consecutive doji candles, with the middle doji gapping above the first and third. The pattern appears at the top of an uptrend and signals a significant reversal. The three consecutive dojis represent three sessions of extreme indecision—where the open and close are virtually identical, meaning neither buyers nor sellers won the session. The fact that this indecision occurs three times in a row at the top of an uptrend is a powerful warning that bullish momentum has completely evaporated. The middle doji gapping higher adds a star formation element, suggesting the market attempted to continue higher but could not. Due to its rarity, the tri-star is difficult to observe in practice, but when it does appear, it is one of the most significant reversal signals.
History & Etymology
The tri-star originates from Japanese candlestick analysis and was described by Steve Nison. It builds on the significance of doji candles (indecision) and the star formation concept (gap away from the prior candle). Combining these two elements three times creates one of the most extreme indecision signals possible.
'Tri' means three. 'Star' refers to the star formation created by the gapping dojis. The Japanese name 'sansei boshi' means 'three star formation.'
How It Forms
Formation Steps
- 1Three consecutive doji candles
- 2The second (middle) doji gaps above the first and third
- 3The first doji appears after an uptrend
- 4The pattern forms a star-like shape
Prerequisites
- Established uptrend
- Each candle should be a doji or near-doji (open and close very close)
Confirmation Signals
- Fourth candle is bearish and closes below the first doji's open
- Volume increases on the fourth candle
- The gap between the first and second doji remains unfilled initially
Invalidation Signals
- Strong bullish candle after the three dojis
- Price breaks above the second doji's high with conviction
- Volume supports continuation higher
Candle Breakdown
First Doji
A doji appearing after the uptrend, showing the first session of indecision.
The first hint that momentum has stalled. Buyers and sellers battle to a draw.
Second Doji (Star)
A doji that gaps above the first, forming the star position. Despite gapping higher, neither side wins.
The market gaps higher but cannot make progress—a second consecutive draw despite the attempt to continue the uptrend.
Third Doji
A third doji that gaps back down toward the first doji's level, completing the tri-star formation.
Three straight sessions of complete indecision. The market has lost all directional conviction. A reversal is imminent.
Psychology
Three consecutive dojis represent the complete absence of directional conviction. At the top of an uptrend, this extreme indecision signals that buyers have lost their edge and a reversal is likely.
Buyer Perspective
Buyers see three straight sessions where they cannot push price higher despite the prior uptrend. Their confidence collapses.
Seller Perspective
Sellers recognize that the uptrend has stalled completely. Three sessions without progress gives them the confidence to enter short positions.
Smart Money Action
Smart money uses the three sessions of indecision to quietly build short positions while the market is frozen.
Retail Trader Trap
Retail traders hold long positions through the three dojis expecting a continuation that never comes.
Emotional Cycle
Trading Strategy
Aggressive Entry
Enter short at the close of the third doji.
Conservative Entry
Wait for a bearish candle to form after the tri-star before entering short.
Previous swing low before the uptrend
Measured move equal to the height of the gap
Next major support level
Best Conditions
- Timeframe: 1D
- Timeframe: 1W
- After extended uptrends
- At major resistance levels
- Asset: Stocks
- Asset: Indices
- Asset: Forex
Avoid When
- Timeframe: 1m
- Timeframe: 5m
- Timeframe: 15m
- Volatile markets with large intraday ranges
Confluence Factors
- Pattern at resistance
- RSI overbought
- Moving average nearby
- Volume declining
- Fibonacci extension at the star level
Scale In Strategy
Enter after the tri-star, add on bearish confirmation.
Scale Out Strategy
Take 50% at first target, trail rest.
Risk Management
Volume Analysis
Volume Confirmation
Low volume on the three dojis confirms indecision. Volume should increase on the confirming bearish candle.
Volume Profile
Volume should be at its lowest during the tri-star and spike on the breakdown candle.
Volume Divergence
High volume on any of the three dojis suggests something other than indecision is occurring.
Technical Confluence
Support Resistance
The tri-star zone becomes a resistance area. The star's high is the key level to watch.
Fibonacci Levels
The tri-star often forms at Fibonacci extension levels of prior moves.
Moving Averages
The tri-star at a major moving average (50 or 200 SMA) adds significant confluence.
Rsi Confirmation
RSI above 70 with the tri-star is a powerful overbought reversal signal.
Macd Confirmation
MACD showing divergence (declining while price is flat at the tri-star) confirms weakening momentum.
Bollinger Bands
The tri-star near the upper Bollinger Band with the bands narrowing suggests a volatility expansion (reversal) is coming.
Vwap
The tri-star at or above VWAP confirms the pattern is in a premium zone.
Ichimoku Cloud
Tri-star above the Kumo cloud at resistance adds Ichimoku context.
Elliott Wave
The tri-star can mark the exact terminal point of a fifth wave.
Wyckoff Phase
May represent the UTAD or PSY during Wyckoff distribution.
Market Profile
The three dojis represent price acceptance at a single level—a balanced area before rotation.
Order Flow
Neutral delta on all three dojis with a shift to negative on the fourth candle confirms the reversal.
Open Interest
Declining open interest during the dojis suggests participants are uncertain about direction.
Multi-Timeframe Analysis
Higher Timeframe Alignment
Daily tri-star at weekly resistance is an exceptionally rare and powerful signal.
Lower Timeframe Entry
Use the 4H chart to confirm the reversal after the daily tri-star.
Timeframe Confluence
Weekly overbought conditions with daily tri-star is the ultimate reversal signal.
Top-Down Approach
Weekly resistance > Daily tri-star > 4H bearish confirmation.
Statistics
Historical Examples
USD/JPY Tri-Star Formation
successUSD/JPY formed a rare tri-star at 151.90, near the intervention level. The pattern preceded a 500-pip decline as the Bank of Japan intervened.
Lesson: Tri-star patterns near known intervention or policy levels can precede massive moves.
Variations
Near Tri-Star
Three consecutive near-doji candles (very small bodies) with the characteristic gap.
Confusion Matrix
Patterns commonly confused with Bearish Tri-Star and how to distinguish them.
Bearish Evening Doji Star
7500% similarCount the dojis. One doji in the middle with normal candles on either side = evening doji star. Three consecutive dojis = tri-star.
Key Differences
- Evening doji star has one doji (the middle candle); tri-star has three dojis
- Evening doji star has a bullish first candle and bearish third; tri-star has all dojis
- Tri-star is much rarer
The Bearish Doji Star is a two-candle reversal pattern featuring a strong bullish candle followed by a doji that gaps above it, signaling that buying momentum has stalled and indecision has replaced conviction at the top of an uptrend.
The Evening Doji Star is a top-tier three-candle bearish reversal pattern. The doji in the star position represents the pivot point between bullish confidence (first candle) and bearish dominance (third candle), making it one of the most reliable reversal signals in candlestick analysis.
The Bullish Tri-Star is an extremely rare reversal pattern consisting of three consecutive doji candles with the middle one gapping below the others. It signals maximum indecision and a potential major trend reversal.
The Bearish Abandoned Baby is one of the rarest and most reliable top reversal patterns in candlestick analysis. It features a doji that is completely isolated by gaps on both sides, signaling an abrupt and dramatic shift from buying to selling pressure.
The Bearish Advance Block shows three consecutive bullish candles with progressively smaller bodies and longer upper shadows, signaling that buying momentum is weakening and a reversal or consolidation is likely.
The Deliberation pattern shows two strong bullish candles followed by a small-bodied third candle, indicating that the uptrend is 'deliberating' — the bulls have stalled and are uncertain about pushing higher.
Pro Tips & Common Mistakes
Pro Tips
- The tri-star is one of the rarest patterns—do not force its identification.
- All three candles must be genuine dojis (or near-dojis) for the pattern to be valid.
- The middle doji should gap above the others—without the gap, it is not a star formation.
- Due to its rarity, always require a confirming bearish candle before entering.
- On weekly charts, a tri-star is an extraordinary signal that should not be ignored.
Common Mistakes
- Accepting candles with visible bodies as dojis
- Not requiring the gap for the middle doji
- Trading without a confirming candle
- Looking for tri-stars on intraday charts where dojis are less meaningful
Advanced Techniques
- Use the exact open/close prices to verify true doji status for each candle.
- The tri-star on a weekly chart is a generational signal—treat it with the highest respect.
Institutional Perspective
Three consecutive sessions of equilibrium at the top of an uptrend suggest that institutional buying has completely dried up and institutional selling has neutralized any remaining buying pressure.
Fun Facts
- The tri-star is often cited as the single rarest classical candlestick pattern.
- Some traders go their entire careers without seeing a true tri-star formation on a daily chart.
- The pattern's rarity actually adds to its power—when it does appear, it commands attention from all levels of market participants.
Frequently Asked Questions
Three consecutive doji candles at the top of an uptrend, with the middle doji gapping above the others. This extremely rare pattern signals that buying momentum has completely evaporated, and a reversal is imminent.
The tri-star is one of the rarest candlestick patterns. Three consecutive true dojis with the proper gap structure may appear only a few times per year across all major markets.