Overview
Bullish Pennant
Also known as: Bull Pennant, Continuation Pennant, Symmetrical Pennant
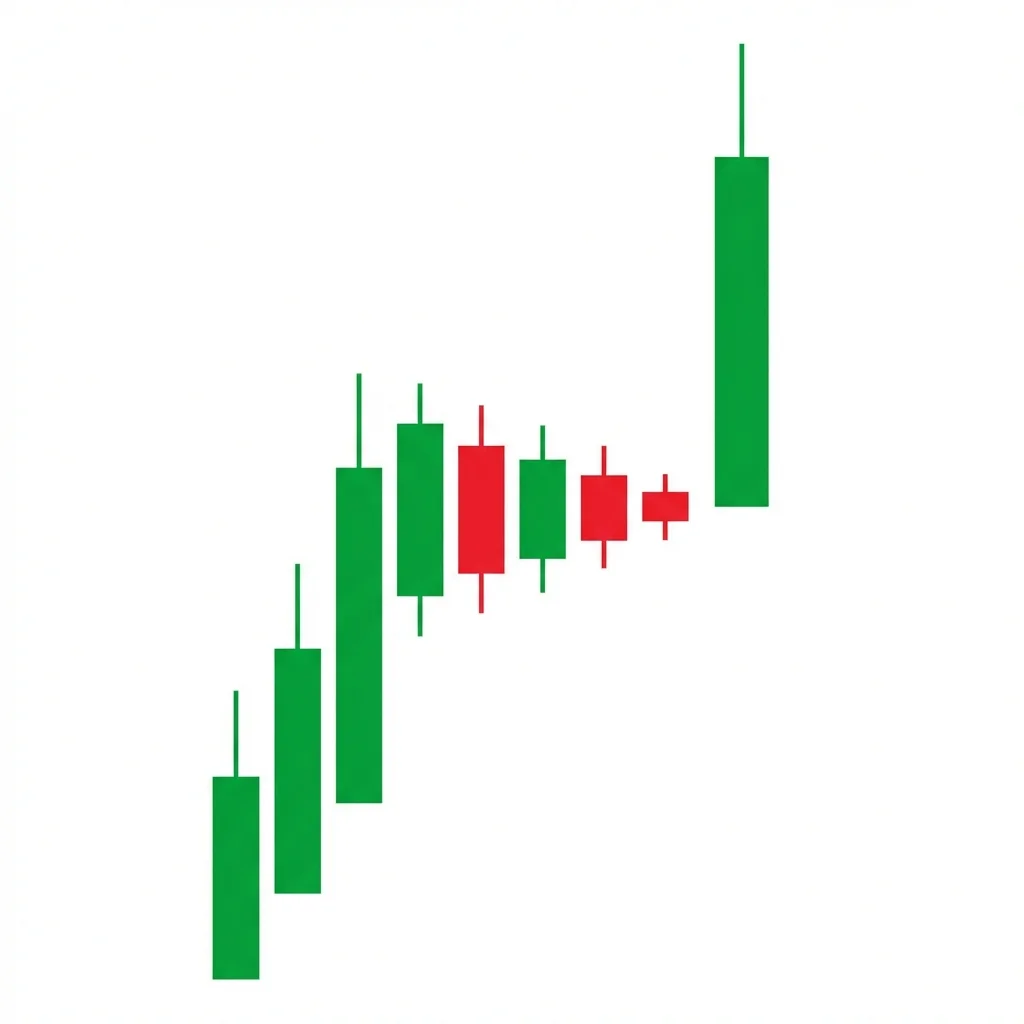
The Bullish Pennant is a continuation pattern featuring a sharp advance (flagpole) followed by a brief triangular consolidation (pennant), before price breaks out and continues higher with a measured move equal to the flagpole.
The Bullish Pennant is one of the most reliable continuation patterns. It forms after a sharp, nearly vertical price advance (the flagpole) when the market pauses to consolidate in a small symmetrical triangle (the pennant). The converging trendlines of the pennant show decreasing volatility as the battle between profit-takers and new buyers temporarily creates equilibrium. When price breaks above the pennant, it typically advances a distance equal to the flagpole's height — the 'measured move' target. The pattern works because the sharp advance creates momentum that is not exhausted by the brief consolidation, and the declining volume during the pennant confirms that holders are not distributing.
History & Etymology
The pennant pattern has been documented in technical analysis since the early 20th century. It is closely related to the flag pattern but is distinguished by its triangular shape rather than rectangular. The pattern is one of the 'classic' chart formations taught in every technical analysis course.
Named after a pennant (a small triangular flag), which the consolidation pattern resembles. The flagpole creates the staff, and the triangular consolidation creates the pennant shape.
How It Forms
Formation Steps
- 1Flagpole: a sharp, nearly vertical price advance
- 2Pennant: a small symmetrical triangle formed by converging support and resistance lines
- 3Breakout: price breaks above the upper trendline of the pennant on expanding volume
Prerequisites
- Prior sharp advance (the flagpole)
- Converging trendlines forming a triangular consolidation
- The pennant should be relatively small compared to the flagpole
- Volume should decline during the pennant formation
Confirmation Signals
- Price breaks above the upper trendline of the pennant
- Volume surges on the breakout
- The breakout candle closes above the pennant resistance
Invalidation Signals
- Price breaks below the lower trendline
- Volume increases during the pennant (distribution)
- The consolidation lasts too long (>3 weeks typically)
Candle Breakdown
Flagpole
A sharp, strong advance that establishes the bullish momentum
Strong buying drives price sharply higher. This creates the momentum that will survive the consolidation.
Pennant Formation
Small candles within converging trendlines creating a triangular consolidation
The market pauses as profit-takers and new buyers reach temporary equilibrium. Declining volume shows holders are not selling.
Breakout Candle
A strong bullish candle breaking above the upper trendline of the pennant
The equilibrium breaks in favor of buyers. The volume surge confirms the breakout and the measured move begins.
Psychology
The pennant represents a brief pause in a powerful advance. The converging trendlines show decreasing volatility and declining participation — the market is resting, not reversing. The breakout releases the compressed energy.
Buyer Perspective
Buyers see the declining volatility as a healthy pause. They prepare to buy the breakout, knowing the measured move target provides clear profit potential.
Seller Perspective
Profit-takers create the initial selling but are quickly overwhelmed on the breakout. Those who shorted the consolidation are trapped.
Smart Money Action
Institutions accumulate during the pennant, taking the other side of profit-takers' sales. The declining volume shows they are absorbing supply without pushing price.
Retail Trader Trap
Retail traders who shorted the pennant's lower trendline are trapped by the upside breakout.
Emotional Cycle
Trading Strategy
Aggressive Entry
Buy when price breaks above the upper trendline of the pennant.
Conservative Entry
Wait for a close above the upper trendline with volume confirmation.
Measured move: flagpole height projected from the breakout.
1.5x the flagpole height.
2x the flagpole height or next resistance.
Best Conditions
- Timeframe: daily
- Timeframe: 4h
- Timeframe: 1h
- Timeframe: weekly
- trending market
- bull market
- sector momentum
- Asset: stocks
- Asset: forex
- Asset: crypto
- Asset: indices
- Asset: commodities
Avoid When
- Timeframe: 1m
- choppy market
- end of trend
- approaching major resistance
Confluence Factors
- Strong flagpole with high volume
- Declining volume in pennant
- Pennant forms above key support
- Moving averages trending up
- Relative strength positive
Scale In Strategy
Enter on the breakout, add on the first pullback to the pennant top.
Scale Out Strategy
Take one-third at each profit level.
Risk Management
Volume Analysis
Volume Confirmation
Volume must decline during the pennant and surge on the breakout.
Volume Profile
Flagpole: high volume. Pennant: declining volume. Breakout: surging volume.
Volume Divergence
Increasing volume in the pennant suggests distribution — avoid.
Technical Confluence
Support Resistance
The upper trendline becomes support after the breakout. The pennant low is the stop level.
Fibonacci Levels
The pennant often retraces 38.2-50% of the flagpole — a healthy correction.
Moving Averages
The pennant typically forms above the 20-day EMA, which acts as dynamic support.
Rsi Confirmation
RSI staying above 50 during the pennant confirms bullish momentum.
Macd Confirmation
MACD remaining positive with a histogram pullback during the pennant.
Bollinger Bands
Band squeeze during the pennant signals imminent volatility expansion.
Vwap
Pennant holding above VWAP confirms institutional support.
Ichimoku Cloud
Pennant above the cloud confirms the uptrend.
Elliott Wave
Pennants often form as Wave 4 corrections before Wave 5.
Wyckoff Phase
Represents a brief re-accumulation within the markup.
Market Profile
The pennant creates a balance area; the breakout is an initiative move.
Order Flow
Passive buying absorbs profit-taking during the pennant.
Open Interest
Stable or rising OI during the pennant with a surge on breakout.
Multi-Timeframe Analysis
Higher Timeframe Alignment
A daily pennant within a weekly uptrend is the optimal context.
Lower Timeframe Entry
Use 1H to identify the exact breakout point within the daily pennant.
Timeframe Confluence
The pennant on the daily with a clean weekly trend is highest probability.
Top-Down Approach
Confirm weekly uptrend, identify daily pennant, enter on breakout.
Statistics
Historical Examples
Bitcoin Bull Pennant
successBitcoin rallied from $27,000 to $35,000 (flagpole), formed a tight pennant for 5 days, then broke out and reached the $43,000 measured move target.
Lesson: Crypto pennants can produce massive measured moves in high-momentum environments.
NVIDIA Earnings Pennant
successAfter a strong earnings-driven advance, NVIDIA formed a clean pennant that broke out and continued to new highs, exceeding the measured move target.
Lesson: Pennants after earnings-driven rallies in sector leaders are high-probability setups.
Variations
Ascending Pennant
The pennant has a slight upward bias (rising bottom, flat or slightly rising top).
Bull Flag (Rectangular)
A parallel-sided consolidation rather than converging trendlines.
Confusion Matrix
Patterns commonly confused with Bullish Pennant and how to distinguish them.
Bullish Flag
8000% similarDraw the trendlines. If they converge to a point, it's a pennant. If they're parallel, it's a flag.
Key Differences
- Flag has parallel trendlines (rectangle)
- Pennant has converging trendlines (triangle)
Bullish Ascending Triangle
6000% similarCheck if the upper line is flat (ascending triangle) or declining (pennant).
Key Differences
- Ascending triangle has a flat top and rising bottom
- Pennant has both lines converging symmetrically
A bearish pennant is a continuation pattern that forms after a sharp decline, creating a small symmetrical triangle as the market consolidates before resuming its downward move. The measured target equals the flagpole's length projected from the breakout point.
The Bullish Ascending Triangle is a continuation pattern featuring flat resistance and rising support. Buyers are consistently willing to pay higher prices, compressing the range until a breakout above resistance triggers the next leg up.
The Bullish Flag is the quintessential continuation pattern: a sharp rally (pole) followed by a brief, tight consolidation (flag) before the next leg up. It represents a healthy pause in a strong uptrend.
The High Tight Flag is one of the rarest and most powerful bullish continuation patterns. It features a stock that doubles in price quickly, then consolidates in a very tight range before breaking out to potentially double again.
The Broadening Top (Megaphone) is a chart formation characterized by expanding price swings that create higher highs and lower lows, reflecting increasing volatility and instability at market tops before a bearish breakdown.
The Descending Channel is a chart formation where price trends lower within two parallel downward-sloping trendlines, making consistent lower highs and lower lows in an orderly bearish progression.
Pro Tips & Common Mistakes
Pro Tips
- The pennant should be brief (1-3 weeks) — longer consolidations lose their continuation properties
- Volume MUST decline during the pennant and surge on the breakout
- The flagpole height provides the measured move target from the breakout point
- The tighter the pennant (less retracement of the flagpole), the more bullish
- Enter on the breakout day — don't chase days later
Common Mistakes
- Confusing a pennant with a symmetrical triangle — pennants require a preceding flagpole
- Not measuring the flagpole correctly for the target calculation
- Ignoring volume — the pennant MUST show declining volume
- Waiting too long to enter after the breakout, degrading risk-reward
- Trading pennants that form over months (these are triangles, not pennants)
Advanced Techniques
- Use the pennant apex (where trendlines meet) as a time target for the breakout
- Apply Bollinger Band width to quantify the volatility compression
- Combine with relative strength to identify the strongest pennant candidates
- Trail stops using the pennant's lower trendline extended after the breakout
Institutional Perspective
Pennants are among the patterns most reliably used by quantitative and systematic trading strategies. The clear measured-move target and well-defined stop level make it ideal for risk-managed institutional approaches.
Fun Facts
- The pennant is named after the small triangular flags used on ships and in sports.
- Studies show pennant breakouts are more reliable than symmetrical triangle breakouts because the preceding flagpole provides momentum context.
- The pennant is one of the few patterns where the measured-move target is reached more than 65% of the time.
Frequently Asked Questions
A continuation pattern where a sharp advance (flagpole) is followed by a small triangular consolidation (pennant), before price breaks out and advances a measured distance equal to the flagpole.
Typically 1-3 weeks on a daily chart. Pennants that extend beyond this lose their continuation properties and become symmetrical triangles.
A pennant has converging trendlines (triangle shape), while a flag has parallel trendlines (rectangle shape). Both are continuation patterns with similar trading rules.