Overview
Bullish Support Bounce
Also known as: Support Test, Demand Zone Bounce, Support Rebound
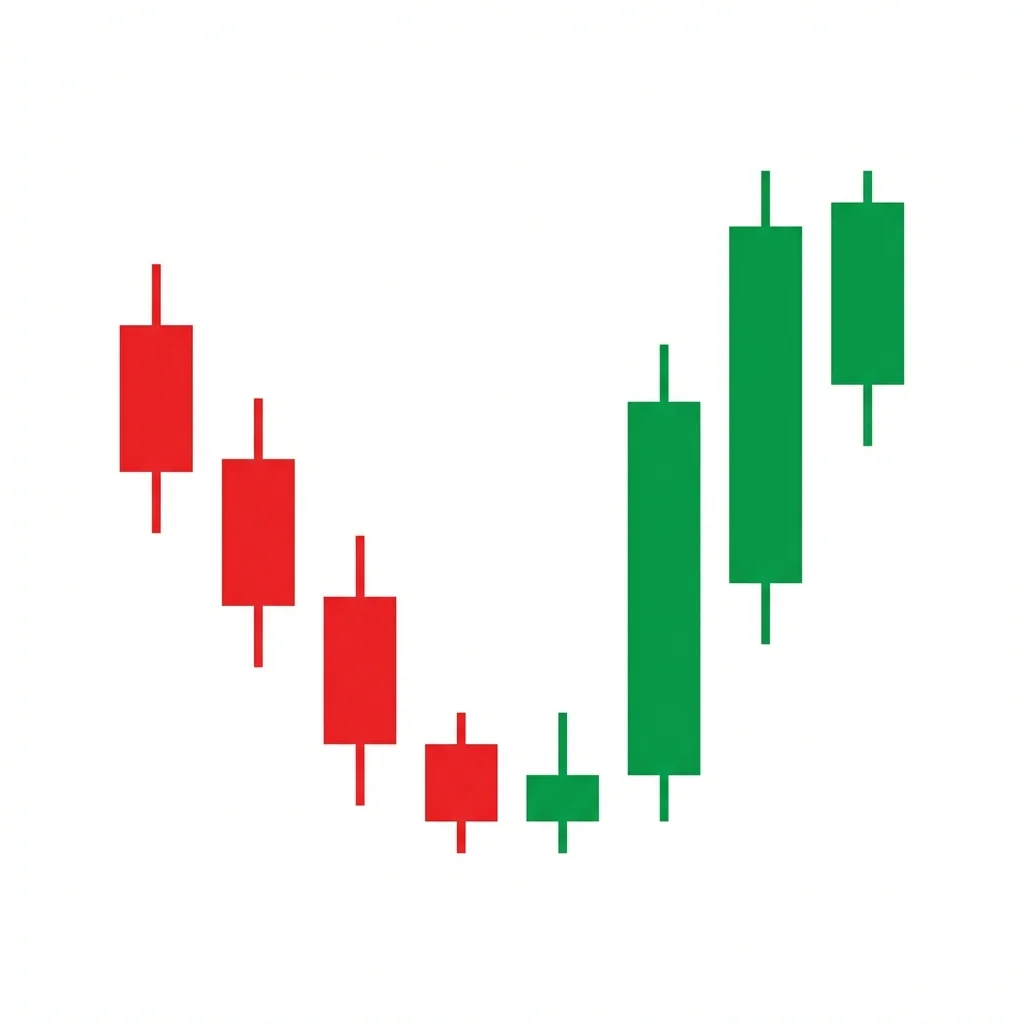
The Bullish Support Bounce is one of the most fundamental trading patterns where price declines to a well-established support level and bounces higher, confirmed by bullish price action and volume at the support zone.
Support bounces are the foundation of technical trading. When price approaches a level where buying interest has historically emerged, traders anticipate that demand will again overwhelm supply. The support level can be horizontal (previous lows, pivot points), dynamic (moving averages, trendlines), or based on volume (VWAP, volume profile nodes). The pattern is confirmed when price produces a bullish reaction at support — a hammer, engulfing candle, or any clear rejection of lower prices. The more times a support level has been tested and held, the stronger it becomes, though each test also weakens it incrementally.
History & Etymology
Support and resistance trading dates back to the earliest days of technical analysis. Charles Dow discussed the concept in his Wall Street Journal editorials in the late 1800s. The support bounce is perhaps the most universally traded pattern across all markets, timeframes, and asset classes.
Named straightforwardly for the price action: price reaches a 'support' level (a floor where demand emerges) and 'bounces' (reverses upward from that level).
How It Forms
Formation Steps
- 1Price declines toward a well-established support level with previous touches
- 2Price tests the support level and shows rejection (long lower shadow, bullish engulfing, or hammer)
- 3Buyers step in at support, producing a bounce with bullish price action
Prerequisites
- Clearly defined support level with at least two prior touches
- Price approaches support from above (pullback or decline)
- Support level is significant (horizontal level, moving average, trendline, or demand zone)
Confirmation Signals
- Bullish rejection candle at support (hammer, engulfing, pin bar)
- Volume spike at the support test
- RSI oversold or showing bullish divergence at the support level
- Follow-through buying on the candle after the bounce
Invalidation Signals
- Price closes below support with conviction
- Volume is heavy on the breakdown below support
- No bullish rejection candle — price just sits on support weakly
Candle Breakdown
Approach Candles
Price declines toward the support level, showing decreasing momentum as it approaches the demand zone
Selling pressure weakens as price approaches known support. Experienced traders begin placing limit buy orders at the level.
Bounce Candle
A bullish candle at the support level showing rejection of lower prices — often a hammer, engulfing, or pin bar
Buying demand overwhelms selling at the support level. The long lower shadow shows aggressive buying at lower prices, pushing price back up.
Psychology
The Support Bounce is driven by collective memory of prior price action. Traders remember where buying previously emerged and expect it to occur again. This creates a self-fulfilling prophecy as multiple participants act on the same level.
Buyer Perspective
Buyers view the support level as a value zone. They place limit buy orders at or near support, anticipating that the level will hold again. Each successful bounce reinforces their confidence.
Seller Perspective
Sellers who drove price toward support may take profits as price approaches a known demand zone. Short sellers recognize the risk of shorting into well-established support.
Smart Money Action
Institutions often have standing buy orders at key support levels. They accumulate during support tests and may also sell puts at support, profiting from the premium if support holds.
Retail Trader Trap
Retail traders may sell at support in panic after a decline, only to see price bounce immediately. Others may short the breakdown that never materializes.
Emotional Cycle
Trading Strategy
Aggressive Entry
Place a limit buy order at the support level with a stop below.
Conservative Entry
Wait for a bullish rejection candle to close at support before entering long.
The midpoint of the recent decline (50% retracement).
The origin of the decline or the next resistance level.
Previous swing high.
Best Conditions
- Timeframe: daily
- Timeframe: 4h
- Timeframe: 1h
- Timeframe: 15m
- uptrend pullback to support
- range-bound market
- after a controlled decline
- Asset: stocks
- Asset: forex
- Asset: crypto
- Asset: ETFs
- Asset: futures
Avoid When
- Timeframe: 1m
- strong downtrend that may break support
- panic selling
- deteriorating fundamentals
Confluence Factors
- Multiple support types converge (horizontal + MA + Fibonacci)
- Bullish rejection candle at support (hammer, engulfing)
- RSI oversold or showing divergence at support
- Volume confirms demand at the level
- Higher timeframe trend supports the bounce
Scale In Strategy
Enter a starter position at support and add when the bounce is confirmed by the next candle.
Scale Out Strategy
Take profits at resistance levels above, trailing the final portion with a moving average.
Risk Management
Volume Analysis
Volume Confirmation
A volume spike at the support test followed by strong volume on the bounce candle confirms institutional buying.
Volume Profile
High volume at the support zone in the volume profile confirms it as a significant demand area.
Volume Divergence
Declining volume during the approach to support and increasing volume on the bounce is ideal.
Technical Confluence
Support Resistance
The core of this pattern IS support and resistance. The more times support has held, the more significant the bounce.
Fibonacci Levels
Support that aligns with a 50% or 61.8% Fibonacci retracement is significantly more reliable.
Moving Averages
The 50-day and 200-day moving averages are the most widely watched dynamic support levels.
Rsi Confirmation
RSI below 30 at support or showing bullish divergence dramatically increases the bounce probability.
Macd Confirmation
MACD histogram contraction at support with a potential bullish crossover adds confidence.
Bollinger Bands
Price touching the lower Bollinger Band at a support level creates a strong confluence.
Vwap
VWAP as support (especially on intraday charts) is highly reliable due to institutional use.
Ichimoku Cloud
Support at the Kumo cloud, Tenkan-sen, or Kijun-sen adds Ichimoku-based confluence.
Elliott Wave
Support bounces often occur at Wave 2 and Wave 4 corrective lows.
Wyckoff Phase
Support bounces within accumulation ranges are consistent with Wyckoff secondary tests.
Market Profile
Support at the Value Area Low or Point of Control on the market profile is highly significant.
Order Flow
Visible bid clusters in the order book at the support level confirm demand.
Open Interest
Stable open interest at support suggests position holders are not liquidating.
Multi-Timeframe Analysis
Higher Timeframe Alignment
A weekly support level with a daily bounce provides the strongest signal.
Lower Timeframe Entry
Use the 1-hour or 15-minute chart to time the entry at a daily support bounce.
Timeframe Confluence
Weekly support, daily bounce candle, and 4-hour follow-through is the ideal multi-timeframe setup.
Top-Down Approach
Weekly/monthly identifies the support level, daily confirms the bounce, and intraday times the entry.
Statistics
Historical Examples
SPY 200-Day MA Bounce
successSPY tested the 200-day moving average support near $410 and formed a hammer candle with elevated volume. The bounce produced a rally above $460 over the following months.
Lesson: The 200-day moving average is one of the most widely watched support levels. Bounces with clear rejection candles at this level are high-probability trades.
EUR/USD at 1.0500 Support
successEUR/USD tested the well-established 1.0500 round number support with a bullish engulfing candle. The bounce carried price to 1.0700.
Lesson: Round numbers on major forex pairs act as strong psychological support levels.
Failed Support at Broken Level
failureTSLA tested a support level at $250 that had held twice before. This time, the bounce was weak and support eventually broke, with price declining to $100.
Lesson: Each test of support weakens it. When the bounce is weak (small body, low volume), be cautious — the level may break on the next test.
Variations
First Touch Bounce
The very first time price establishes a support level and bounces.
Moving Average Bounce
Support bounce specifically at a key moving average (50, 100, or 200-day).
Confusion Matrix
Patterns commonly confused with Bullish Support Bounce and how to distinguish them.
Bullish Double Bottom
7000% similarA double bottom has two well-defined lows with a peak between them. A support bounce is a single test of support.
Key Differences
- Double Bottom requires two distinct touches separated by a meaningful rally
- Support Bounce can be any single touch of an established support level
Bullish Hammer
6500% similarA hammer is a candle type; a support bounce is a price action pattern. A hammer at support is a support bounce, but not all support bounces involve hammers.
Key Differences
- Hammer is a specific candle shape (small body, long lower shadow)
- Support Bounce is a broader concept that may or may not include a hammer candle
A bearish resistance rejection occurs when price rallies into a well-established resistance level and is met with selling pressure, producing bearish candles with long upper wicks. The repeated failure to break through resistance signals a reversal.
The Double Bottom is one of the most recognized reversal patterns, forming a W-shape where price tests a support level twice and bounces, signaling that sellers cannot push through and buyers are gaining control.
The Bullish Engulfing is one of the most popular and reliable two-candle reversal patterns. A large bullish candle completely engulfs the prior bearish candle body, signaling a decisive shift from selling to buying control.
A Bullish Key Reversal occurs when price makes a new low during a downtrend but reverses to close above the prior bar's high on heavy volume, signaling a dramatic single-day shift in control from sellers to buyers.
The Piercing Line is a two-candle bullish reversal pattern where a bearish candle is followed by a bullish candle that opens below the low and 'pierces' above the midpoint of the first candle's body, showing strong buying recovery.
The Broadening Top (Megaphone) is a chart formation characterized by expanding price swings that create higher highs and lower lows, reflecting increasing volatility and instability at market tops before a bearish breakdown.
Pro Tips & Common Mistakes
Pro Tips
- The more confluence at the support level (horizontal + MA + Fibonacci + round number), the higher the probability of a bounce
- Each test of support weakens it incrementally — the third or fourth test is more likely to break than the first
- The quality of the rejection candle at support matters enormously — a strong hammer or engulfing is far more reliable than a small doji
- Volume on the bounce should confirm institutional participation — a low-volume bounce may fail on the retest
- Always have a clear stop below support — if support breaks, exit without hesitation
Common Mistakes
- Blindly buying every touch of support without waiting for a rejection candle
- Not checking the broader trend — support bounces in strong downtrends fail more often
- Placing stops too tight, getting stopped out by wicks that briefly penetrate support before bouncing
- Ignoring that each subsequent test of support weakens it
- Not considering volume — low-volume bounces are unreliable
Advanced Techniques
- Use volume profile to identify support levels with high-volume nodes, which are more significant than low-volume support
- Combine multiple support types: horizontal, Fibonacci, moving average, and VWAP converging at the same level
- Use options: sell puts at support to profit from premium decay if support holds, or buy calls for leveraged upside
- Apply order flow analysis to see real-time bid absorption at the support level
Institutional Perspective
Institutions use significant support levels as systematic accumulation points. They often have algorithms set to buy at specific support levels (moving averages, prior lows). The support bounce is the most basic form of institutional buying — it works because large players consistently act at the same levels.
Fun Facts
- The support bounce is the most commonly traded pattern in all of technical analysis — it is used by day traders, swing traders, and long-term investors alike.
- 'Buy the dip' — one of the most popular trading mantras — is essentially a support bounce strategy.
- Studies show that the 200-day moving average bounce has one of the highest win rates of any single technical signal, particularly on major indices.
Frequently Asked Questions
A Bullish Support Bounce occurs when price declines to a well-established support level and bounces higher, confirmed by bullish price action such as a hammer, engulfing candle, or pin bar at the support zone.
There is no fixed number, but each test weakens the support level slightly. Generally, the third or fourth test has a higher probability of breaking than the first or second.
The strongest support levels have multiple confluence factors: horizontal price support, moving average support, Fibonacci retracement, round numbers, and volume profile high-volume nodes all converging at the same area.