Overview
Bullish Last Kiss
Also known as: Goodbye Kiss, Breakout Retest, Kiss of Death for Shorts
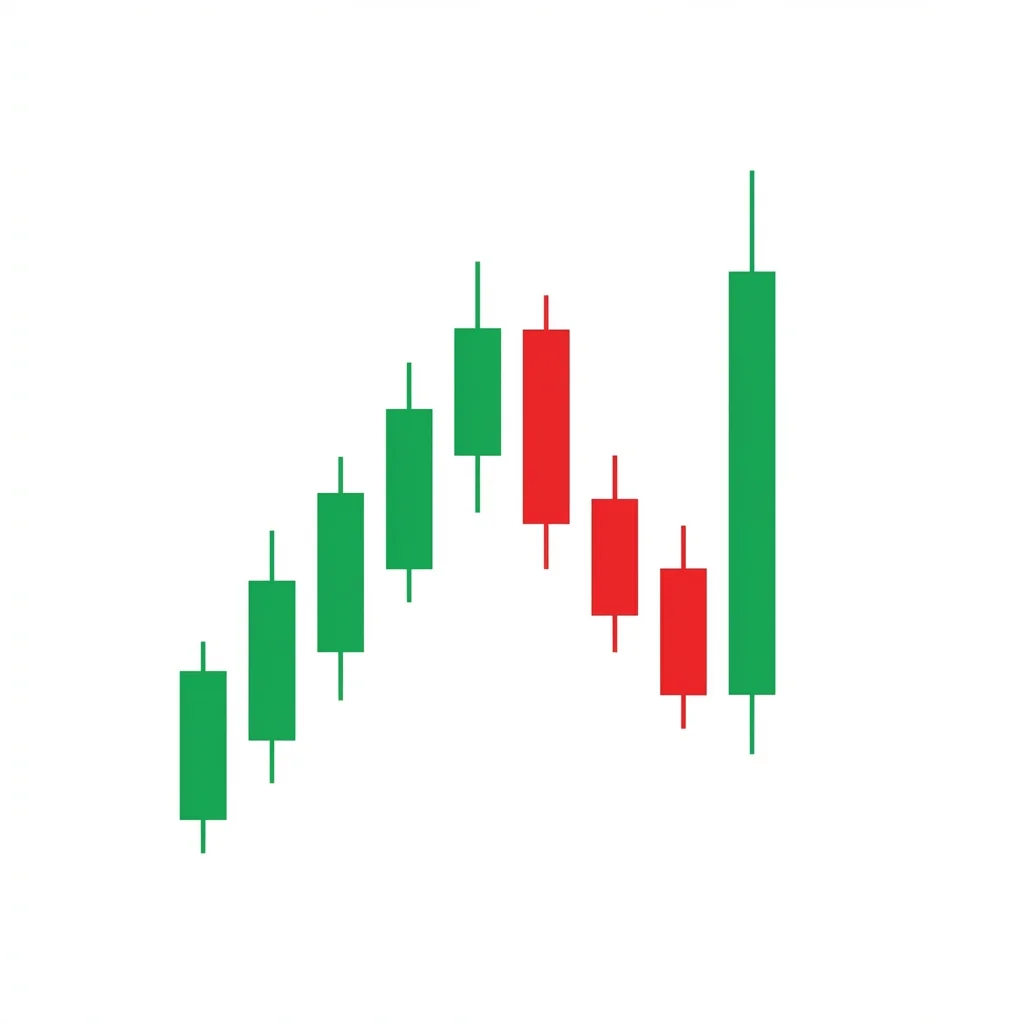
The Last Kiss is a breakout pullback pattern where price returns to test a broken resistance level as new support one final time before continuing the advance — the 'last kiss goodbye' before leaving the old range behind.
The Last Kiss (also known as the Goodbye Kiss or breakout retest) is one of the most reliable and frequently occurring patterns in technical analysis. After price breaks above a significant resistance level, it commonly pulls back to test that level as new support. This pullback represents the market's way of confirming the breakout — if the former resistance holds as support, the polarity principle is validated, and price is likely to continue higher. The pattern gets its poetic name from the idea that price is 'kissing' the old level one last time before moving on permanently.
History & Etymology
The concept of support/resistance polarity — where broken resistance becomes support — has been a cornerstone of technical analysis since its earliest days. The 'last kiss' terminology became popular among traders in the 2000s as a vivid way to describe the breakout pullback retest.
The name 'Last Kiss' describes the price action poetically: after breaking through resistance, price returns to 'kiss' the level one final time (as a goodbye) before continuing its advance. It's the last touch before the old relationship with that price level ends.
How It Forms
Formation Steps
- 1Price trades below a resistance level for an extended period
- 2Price breaks above the resistance with conviction
- 3Price pulls back to test the broken resistance as new support (the 'last kiss')
- 4Price bounces off the former resistance and continues higher
Prerequisites
- Clear resistance level established over multiple touches
- A breakout above the resistance has already occurred
- A pullback to the former resistance level
Confirmation Signals
- Bullish candle bouncing off the former resistance as support
- Declining volume on the pullback, increasing on the bounce
- RSI holding above 50 during the pullback
Invalidation Signals
- Price closes back below the former resistance level
- Heavy volume on the pullback through the level
- Failed bounce with immediate resumption of selling
Candle Breakdown
Breakout Candle
The candle that breaks above the resistance level with conviction
Buyers overwhelm the resistance level. Shorts above the resistance are stopped out.
Last Kiss Candle
Price pulls back to the former resistance, tests it as support, and bounces
Profit-takers from the breakout sell, creating the pullback. The hold at the former resistance confirms the new support.
Psychology
The Last Kiss tests the conviction of the breakout. Early buyers take profits, creating the pullback. When the level holds, it proves the breakout was genuine and attracts new buying from traders who missed the initial move.
Buyer Perspective
Buyers who missed the breakout see the pullback as a second-chance entry. Those who bought the breakout watch anxiously — if the level holds, they add to positions.
Seller Perspective
Remaining bears attempt to push price back below the broken level. Their failure at the retest marks their final capitulation.
Smart Money Action
Institutions often use the pullback to accumulate larger positions. The initial breakout may have been too volatile for their full allocation, but the orderly retest provides the depth they need.
Retail Trader Trap
Retail traders who panic-sell during the pullback or try to short the 'failed breakout' are caught when the level holds and price resumes higher.
Emotional Cycle
Trading Strategy
Aggressive Entry
Buy as price touches the former resistance level during the pullback.
Conservative Entry
Wait for a bullish candle to close above the retest level, confirming the bounce.
The post-breakout high (before the pullback).
Measured move: the height of the prior range projected above the breakout.
2x the measured move or next major resistance.
Best Conditions
- Timeframe: daily
- Timeframe: 4h
- Timeframe: 1h
- Timeframe: weekly
- breakout environments
- trending markets
- sector rotation
- Asset: stocks
- Asset: forex
- Asset: crypto
- Asset: commodities
- Asset: indices
Avoid When
- Timeframe: 1m
- false breakout environments
- choppy markets
- high volatility
Confluence Factors
- Strong volume on initial breakout
- Low volume on pullback
- RSI above 50 during retest
- Moving average alignment
- Multiple timeframe support at the level
Scale In Strategy
Enter 50% on the retest touch, add 50% on the bullish bounce confirmation.
Scale Out Strategy
Take one-third at the prior breakout high, one-third at the measured move, trail the rest.
Risk Management
Volume Analysis
Volume Confirmation
Volume should decline on the pullback and increase on the bounce.
Volume Profile
Low-volume pullback to high-volume breakout level is the ideal profile.
Volume Divergence
Heavy volume on the pullback suggests genuine selling, not a simple retest.
Technical Confluence
Support Resistance
The entire pattern IS the support/resistance polarity principle in action.
Fibonacci Levels
The pullback often retraces 38.2-50% of the breakout move, landing near the former resistance.
Moving Averages
When the former resistance aligns with a moving average, the retest is more powerful.
Rsi Confirmation
RSI staying above 40-50 during the pullback confirms bullish momentum is intact.
Macd Confirmation
MACD remaining positive during the pullback supports the continuation thesis.
Bollinger Bands
The pullback to the middle Bollinger Band often coincides with the last kiss level.
Vwap
The former resistance near VWAP provides strong confluence.
Ichimoku Cloud
A last kiss at the top of the Kumo cloud is an especially powerful setup.
Elliott Wave
The last kiss often occurs as a Wave 2 correction within a new impulse.
Wyckoff Phase
Corresponds to the 'backup to the edge of the creek' (BUEC) in Wyckoff methodology.
Market Profile
The former resistance at a high-volume node provides structural support for the retest.
Order Flow
Buy-side limit orders clustering at the former resistance confirm institutional support.
Open Interest
Rising open interest on the bounce confirms new buying interest.
Multi-Timeframe Analysis
Higher Timeframe Alignment
A daily last kiss at a weekly breakout level is a cornerstone setup.
Lower Timeframe Entry
Use the 1H chart to find the exact bounce from the retest level.
Timeframe Confluence
The level being significant on multiple timeframes strengthens the retest.
Top-Down Approach
Identify the weekly breakout, confirm the daily pullback, enter on the 4H bounce.
Statistics
Historical Examples
S&P 500 4,300 Last Kiss
successThe S&P 500 broke above the 4,300 resistance level, pulled back to test it as support, and bounced cleanly before rallying to 4,600.
Lesson: Major index breakouts frequently offer last kiss entries with excellent risk-reward.
Bitcoin $30K Last Kiss
successBitcoin broke above the $30,000 resistance, pulled back to retest it, and then launched a major rally toward $40,000+.
Lesson: Psychological round numbers serve as excellent last kiss levels in crypto.
Variations
Shallow Last Kiss
Price doesn't quite reach the former resistance before bouncing — a sign of extreme strength.
Undercut Last Kiss
Price briefly dips below the former resistance before recovering.
Confusion Matrix
Patterns commonly confused with Bullish Last Kiss and how to distinguish them.
Bearish Failed Breakout
8000% similarIf the former resistance holds as support on the pullback, it's a last kiss. If price closes back below the level, it's a failed breakout.
Key Differences
- Last kiss holds at the former resistance; failed breakout closes back below it
- Volume pattern differs — last kiss has low volume on pullback
The last kiss occurs when price breaks below support, rallies back to 'kiss' the broken level from below, and is rejected. The old support now acts as resistance, confirming the breakdown and offering an optimal short entry.
The Double Bottom Breakout focuses specifically on the confirmed neckline break of a double bottom pattern, which is the highest-conviction entry point with a clear measured move target and defined risk.
The Bullish Engulfing is one of the most popular and reliable two-candle reversal patterns. A large bullish candle completely engulfs the prior bearish candle body, signaling a decisive shift from selling to buying control.
The Bullish Flag is the quintessential continuation pattern: a sharp rally (pole) followed by a brief, tight consolidation (flag) before the next leg up. It represents a healthy pause in a strong uptrend.
The IHS Neckline Retest is a high-probability continuation entry after an inverse head and shoulders breakout. Price pulls back to test the broken neckline as new support, offering a second chance entry with a tighter stop.
The Bullish Support Bounce is one of the most fundamental trading patterns where price declines to a well-established support level and bounces higher, confirmed by bullish price action and volume at the support zone.
Pro Tips & Common Mistakes
Pro Tips
- Set limit buy orders at the former resistance level to catch the retest automatically
- The pullback should be on declining volume — heavy volume pullbacks suggest genuine selling, not retesting
- Not every breakout retests — about 30-40% of breakouts leave immediately without a last kiss
- The tighter the bounce off the level (the less it overshoots), the stronger the signal
- This pattern works on any timeframe and in any market — it's universal
Common Mistakes
- Panicking and selling during the pullback, thinking the breakout has failed
- Not having a stop — if price closes back below the level, the breakout has genuinely failed
- Placing stops too far below the level, reducing the risk-reward advantage
- Chasing the bounce too far above the retest level
- Confusing a failed breakout with a last kiss — the difference is whether the level holds
Advanced Techniques
- Map the Wyckoff BUEC (backup to the edge of the creek) concept to the last kiss for deeper understanding
- Use the lower timeframe to find the exact bounce candle for a tighter entry
- Monitor the depth of the book at the former resistance — heavy limit buys confirm institutional support
- Combine with the measured-move target from the prior range for precise profit targeting
Institutional Perspective
The last kiss is the preferred institutional entry for breakout trades. The initial breakout is often too volatile and slippery for large orders. The orderly pullback to a known level provides the stable market conditions institutions need to build or add to positions.
Fun Facts
- The 'Last Kiss' is one of the most poetically named patterns in technical analysis.
- The support/resistance polarity principle that underpins the last kiss has been validated in academic studies across multiple asset classes.
- Many professional traders prefer the last kiss entry over the breakout entry because it offers better risk-reward and lower false signal rates.
Frequently Asked Questions
A Last Kiss occurs when price breaks above a resistance level, pulls back to test that level as new support (the 'kiss'), and then bounces higher. It's a second-chance entry after a breakout.
Approximately 60-70% of breakouts pull back to retest the former resistance. This makes the last kiss a common and tradeable pattern.
In a last kiss, the former resistance holds as support and price bounces. In a failed breakout, price closes back below the level. The distinction is whether the level holds.