Overview
Bullish Staircase Up
Also known as: Staircase Pattern, Step Pattern, Higher Highs Higher Lows
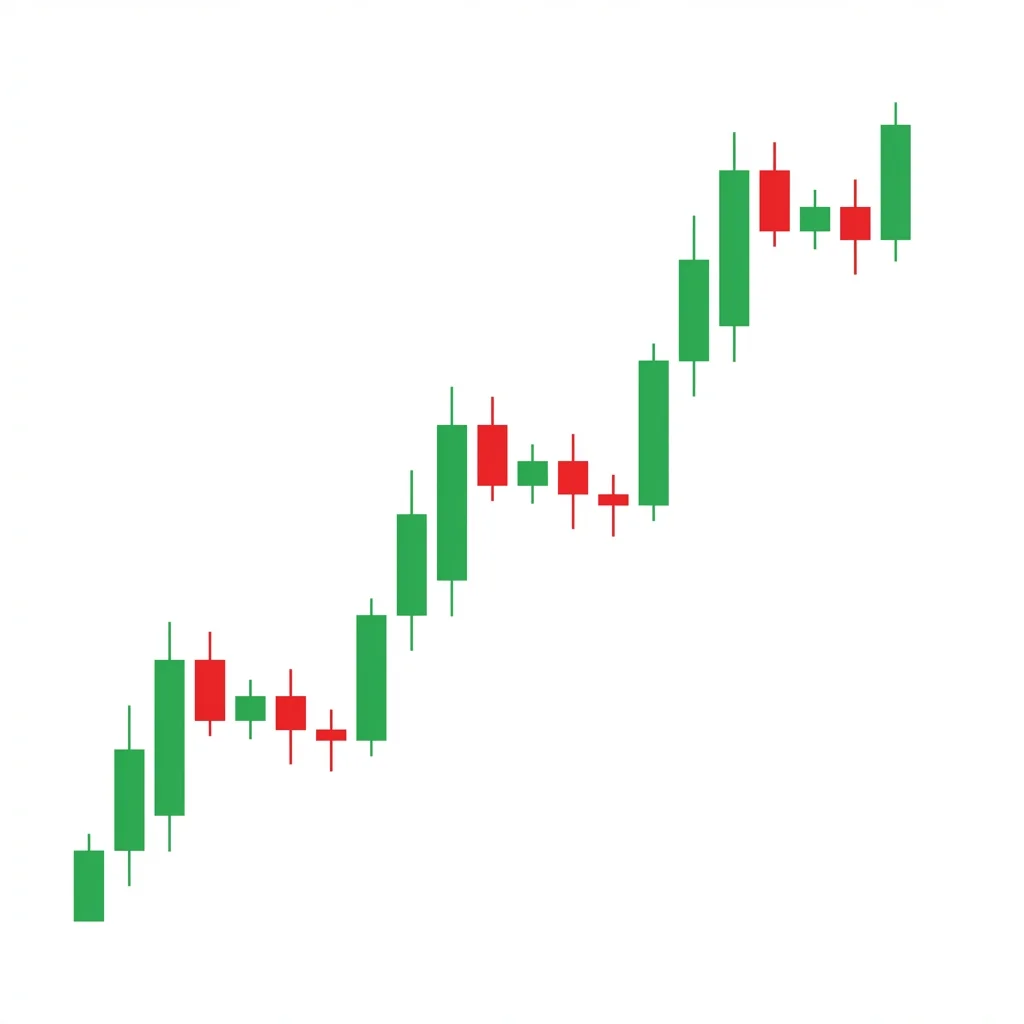
The Bullish Staircase Up is a trend continuation formation consisting of alternating impulse moves and consolidation periods, creating a step-like progression of higher highs and higher lows that confirms a healthy, sustainable uptrend.
The Staircase Up pattern represents the healthiest form of an uptrend: orderly advances followed by orderly consolidations. Each 'step' consists of an impulse leg (the riser) and a consolidation (the tread). The impulse leg shows buying enthusiasm, while the consolidation allows the market to absorb gains, shake out weak hands, and set up for the next advance. This rhythmic pattern indicates that institutional demand is consistent and that the trend has staying power. The pattern continues until the staircase structure breaks — either through a lower low or a failed impulse.
History & Etymology
The staircase or step pattern has been recognized in technical analysis for over a century. Dow Theory's concept of 'higher highs and higher lows' as the definition of an uptrend is the foundation of this pattern. Wyckoff's markup phase often manifests as a staircase of reaccumulation ranges.
Named for its visual resemblance to a staircase, where each impulse leg represents a step up (the riser) and each consolidation represents the flat portion (the tread) before the next step.
How It Forms
Formation Steps
- 1A series of impulse moves (rallies) followed by consolidation periods (steps)
- 2Each consolidation holds above the prior consolidation's support
- 3Each impulse leg reaches higher than the previous one
- 4The pattern creates a visual staircase of ascending steps
Prerequisites
- Established uptrend with clear momentum
- At least two complete 'steps' (impulse + consolidation cycles)
- Each step's low is higher than the prior step's low
Confirmation Signals
- Price breaks above the most recent consolidation with volume
- Each new step shows volume expansion on the impulse and contraction on the consolidation
- Higher lows continue to form on each pullback
Invalidation Signals
- Price breaks below the most recent consolidation's support
- A lower low forms, breaking the higher-highs-higher-lows structure
- Volume expands on a decline rather than on rallies
Candle Breakdown
Impulse Candles (Riser)
Strong bullish candles that form the upward leg of each step, showing momentum and buyer enthusiasm
Buyers drive price higher with conviction. Volume expansion confirms institutional participation and genuine demand.
Consolidation Candles (Tread)
Smaller candles forming a tight range or gentle pullback that absorbs gains and sets up the next impulse
Profit-taking and short-term selling create a pause. Low volume confirms that the selling is not aggressive and supply is being absorbed.
Psychology
The Staircase Up reflects a balanced and healthy trend. Impulse legs show genuine demand, while consolidation periods show orderly absorption of supply. This rhythm creates a sustainable trend that can persist for extended periods.
Buyer Perspective
Buyers add to positions during each consolidation, viewing pullbacks as opportunities. Each new higher high confirms their thesis and encourages continued buying.
Seller Perspective
Sellers take partial profits at each step but are unable to reverse the trend. Each consolidation's support holds, discouraging aggressive shorting.
Smart Money Action
Institutions use each consolidation to accumulate additional positions. The staircase structure allows them to build large positions methodically without chasing price higher during impulse legs.
Retail Trader Trap
Retail traders often sell during consolidation periods fearing a reversal, then chase during impulse legs when they see the trend resume. This buy-high-sell-low behavior is the opposite of institutional positioning.
Emotional Cycle
Trading Strategy
Aggressive Entry
Enter long during the consolidation phase when price pulls back to the step's support level.
Conservative Entry
Wait for price to break above the consolidation high of the most recent step with volume before entering.
The height of the prior impulse leg projected from the breakout.
2x the prior impulse leg height.
Trail until the staircase structure breaks.
Best Conditions
- Timeframe: daily
- Timeframe: 4h
- Timeframe: weekly
- trending bull market
- institutional accumulation phase
- sector rotation into the asset
- Asset: stocks
- Asset: ETFs
- Asset: crypto
- Asset: indices
Avoid When
- Timeframe: 1m
- Timeframe: 5m
- choppy or ranging market
- bearish macro environment
- high volatility with whipsaw action
Confluence Factors
- Each consolidation rests on a rising moving average (20 or 50 EMA)
- Volume rhythm confirms (high on impulse, low on consolidation)
- RSI pulls back from overbought during consolidation but holds above 50
- Sector or market trend supports continued upside
- Institutional flow data confirms accumulation
Scale In Strategy
Add to the position at each new consolidation, building a larger position as the trend proves itself.
Scale Out Strategy
Take partial profits after each impulse leg and trail the rest below the consolidation support.
Risk Management
Volume Analysis
Volume Confirmation
Volume should expand on impulse legs and contract on consolidations — this is the ideal volume rhythm.
Volume Profile
Accumulating volume profile with higher volume on advances and lower volume on pullbacks.
Volume Divergence
Declining volume on impulse legs or increasing volume on consolidations signals the staircase may be weakening.
Technical Confluence
Support Resistance
Each consolidation's support and resistance create a clear map of the trend. Prior resistance becomes support after each new step.
Fibonacci Levels
Each pullback within a step often reaches the 38.2% to 50% retracement of the prior impulse leg.
Moving Averages
The 20 EMA often provides dynamic support during consolidation phases. The 50 SMA marks the wider trend support.
Rsi Confirmation
RSI oscillating between 50 and 70-80 in a rhythmic pattern matches the staircase structure.
Macd Confirmation
MACD histogram expanding on impulses and contracting on consolidations mirrors the pattern.
Bollinger Bands
Price touching the upper band on impulses and returning to the middle band on consolidations is consistent.
Vwap
Each consolidation should hold above the anchored VWAP from the prior step's breakout.
Ichimoku Cloud
Price remaining above the Kumo cloud throughout the staircase confirms the trend.
Elliott Wave
The staircase often corresponds to a series of impulse waves (1-3-5) with corrective waves (2-4) forming the consolidations.
Wyckoff Phase
The staircase is the visual manifestation of the markup phase, potentially with reaccumulation ranges as steps.
Market Profile
Value area migrating higher with each step confirms institutional interest in higher prices.
Order Flow
Cumulative delta trending positive with spikes on impulse legs and flattening on consolidations.
Open Interest
Gradually rising open interest supports the trend's health and sustainability.
Multi-Timeframe Analysis
Higher Timeframe Alignment
A weekly uptrend with daily staircase steps provides the strongest trend-following framework.
Lower Timeframe Entry
Use the 4-hour or 1-hour chart to time entries within each daily consolidation step.
Timeframe Confluence
Weekly trend, daily step identification, and 4-hour entry timing within the consolidation.
Top-Down Approach
Monthly trend direction, weekly staircase structure, daily step breakouts, and intraday entry timing.
Statistics
Historical Examples
NVDA Staircase Rally 2023
successNVDA formed a textbook staircase pattern from January to December 2023, with clear consolidation steps at $200, $280, $370, and $480. Each step showed declining volume before the next impulse leg.
Lesson: Tech stocks with strong fundamental catalysts often form the cleanest staircase patterns, especially when backed by institutional accumulation.
Bitcoin 2020-2021 Staircase
successBTC formed a massive staircase from $10,000 to $69,000 with consolidation steps at $12,000, $20,000, $30,000, $40,000, and $55,000.
Lesson: Crypto staircases can be dramatic, with each step representing a major psychological price level.
Staircase Breakdown
failureARKK had been forming a staircase up but the final step broke below its support and the entire staircase structure collapsed. The ETF declined significantly.
Lesson: When a step's support breaks, exit immediately. The staircase structure provides clear invalidation levels at each step.
Variations
Accelerating Staircase
Each step is shorter in duration and the impulse legs grow larger, showing accelerating momentum.
Decelerating Staircase
Each step takes longer and the impulse legs grow smaller, showing deceleration.
Confusion Matrix
Patterns commonly confused with Bullish Staircase Up and how to distinguish them.
Bullish Ascending Channel
7000% similarIf the pullbacks form clear horizontal ranges (steps), it is a staircase. If the pullbacks follow a smooth ascending support line, it is an ascending channel.
Key Differences
- Ascending channel has smooth parallel trend lines
- Staircase has distinct step-like consolidation plateaus between impulse moves
Bullish Higher Lows
8000% similarHigher Lows is a simpler concept. The Staircase requires clear, defined consolidation ranges (steps) between impulse moves.
Key Differences
- Higher Lows focuses on the ascending support structure
- Staircase includes both the impulse and consolidation dynamics with clear step formation
The bearish staircase down is a trend continuation pattern characterized by a rhythmic series of lower highs and lower lows, creating a step-like descending structure. Each step represents a decline followed by a partial recovery that fails to reclaim the prior high.
The Bullish Ascending Channel is a continuation pattern where price trends upward within two parallel trendlines, providing clear buy zones at the lower boundary and profit targets at the upper boundary.
The Bullish Flag is the quintessential continuation pattern: a sharp rally (pole) followed by a brief, tight consolidation (flag) before the next leg up. It represents a healthy pause in a strong uptrend.
The Higher Lows pattern is the most fundamental bullish structure, showing that buyers are willing to step in at progressively higher prices, indicating strengthening demand and a healthy uptrend.
Bullish Reaccumulation is a Wyckoff continuation pattern where institutions pause an uptrend to absorb supply and build additional positions within a trading range before continuing the markup phase.
The Bullish Rectangle Breakout is a continuation pattern where price consolidates between horizontal support and resistance before breaking above the upper boundary to resume the uptrend.
Pro Tips & Common Mistakes
Pro Tips
- Each step's support level provides a clear, logical stop loss — use it to manage risk on each new position
- The best staircase patterns show volume expansion on impulse legs and contraction on consolidation — this is the volume fingerprint of institutional accumulation
- Add to positions at each new step rather than going all in at once — let the market prove itself
- When a step takes longer to resolve than previous ones, the trend may be maturing — tighten your trailing stop
- The staircase breaks when a step's support fails — this is your exit signal, not a buying opportunity
Common Mistakes
- Buying during the impulse leg when the move is extended instead of waiting for the consolidation
- Panicking during consolidation phases and selling prematurely
- Not trailing stops up to each new step's support level
- Ignoring the volume rhythm — declining volume on impulses signals a weakening staircase
- Holding through a broken step's support, hoping the trend resumes
Advanced Techniques
- Measure the average impulse leg height and use it to project targets for the next step
- Compare the duration of each consolidation — shortening consolidations indicate accelerating momentum; lengthening ones indicate deceleration
- Use the 20 EMA as a dynamic support reference — the healthiest staircases consistently bounce off the 20 EMA during consolidations
- Apply Wyckoff reaccumulation analysis to each step for more precise phase identification
Institutional Perspective
The staircase pattern is the institutional ideal: it allows large players to accumulate positions during consolidation phases and enjoy appreciation during impulse phases. The orderly nature of the staircase reflects controlled, methodical institutional buying. When the staircase breaks, it often means institutions are done buying or have shifted to distribution.
Fun Facts
- The staircase pattern is the visual manifestation of Dow Theory's most fundamental concept: an uptrend is defined by higher highs and higher lows.
- Some of the biggest winning stocks in history (Apple, Amazon, Microsoft during their growth phases) spent years in staircase patterns on weekly charts.
- Professional trend-following CTAs (Commodity Trading Advisors) essentially trade staircase patterns — their systems add on each new step and exit when the structure breaks.
Frequently Asked Questions
A Bullish Staircase Up is a trend continuation formation consisting of alternating impulse legs (steps up) and consolidation periods (flat treads), creating a step-like progression of higher highs and higher lows.
The best entries are during the consolidation phases — either buying the dip to the consolidation's support or entering when price breaks above the consolidation's resistance to start a new step.
The staircase ends when a step's support is broken (a lower low forms), volume patterns deteriorate (declining volume on impulse legs), or the consolidation phases become significantly longer than prior steps.