Overview
Bullish Stick Sandwich
Gyaku Sanpoo Zukae Shita Banare
Also known as: Sandwich Pattern, Stick Sandwich Bottom
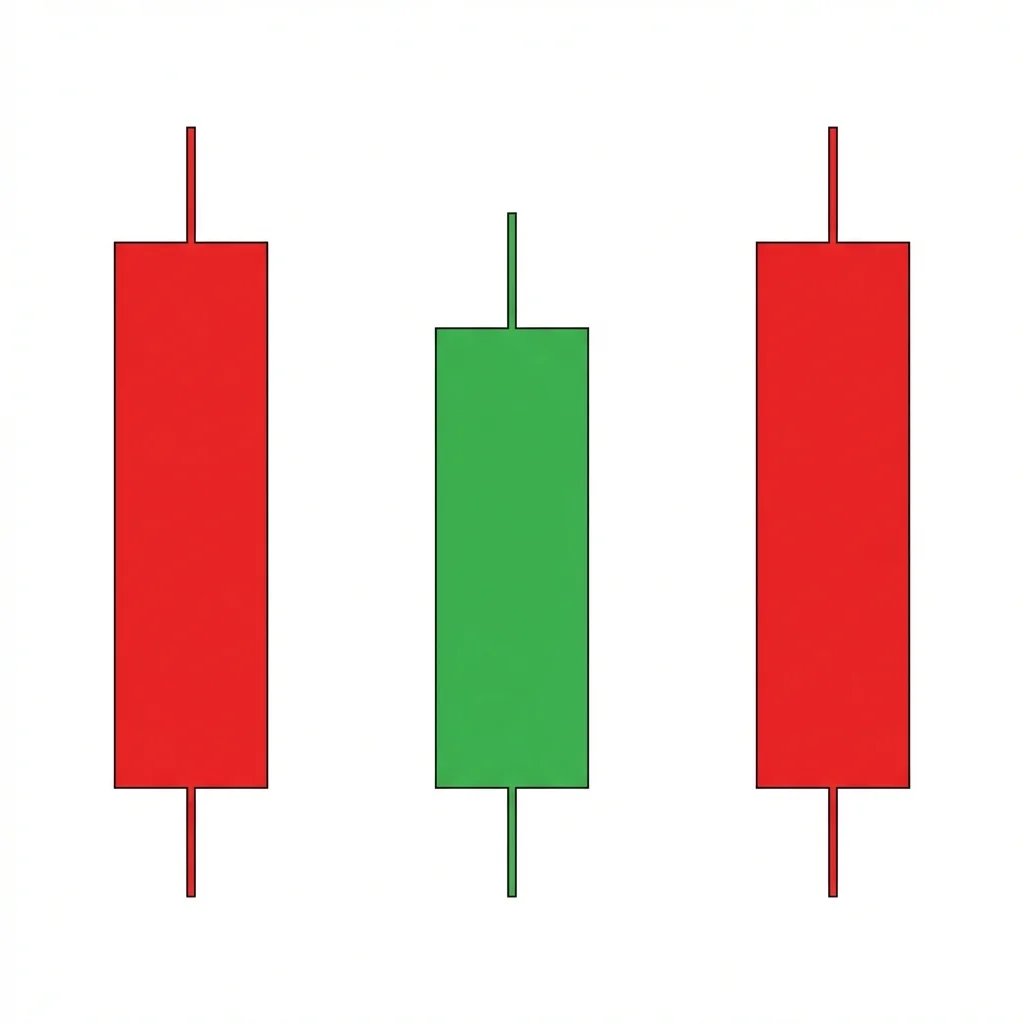
The Bullish Stick Sandwich is a three-candle reversal pattern where two bearish candles with matching closes 'sandwich' a bullish candle, creating a support level at the shared close price that suggests a potential bottom.
The Stick Sandwich is an unusual reversal pattern that relies on the concept of matching close prices. The first and third bearish candles close at the same level, establishing a support zone. The bullish candle in the middle shows that buyers attempted to reverse the trend. When the third candle returns to the same close level as the first, it creates a double-test of that support. If this level holds, the pattern signals that sellers cannot push price below this price, setting up a reversal.
History & Etymology
The Stick Sandwich is one of the lesser-known Japanese candlestick patterns, documented in comprehensive candlestick analysis references. It was introduced to Western traders through Gregory Morris's and Steve Nison's candlestick encyclopedias.
Named 'Stick Sandwich' because the bullish candle (the filling) is sandwiched between two bearish candles (the bread). The 'sticks' refer to the candlestick bodies.
How It Forms
Formation Steps
- 1First candle: a bearish candle closing at a specific price level
- 2Second candle: a bullish candle that opens below the first candle's close and closes above it
- 3Third candle: a bearish candle that closes at approximately the same level as the first candle's close
Prerequisites
- Established downtrend
- First and third candles are bearish with matching (or very close) closing prices
- Second candle is bullish and trades between the two bearish candles
Confirmation Signals
- Fourth candle closes above the third candle's high
- Volume increases on the confirmation candle
- The matching close level acts as support
Invalidation Signals
- Price breaks below the matching close level with conviction
- No follow-through buying after the pattern
- Volume remains heavy on the downside
Candle Breakdown
First Bearish Candle
A bearish candle in the downtrend that closes at a level that will become the pattern's support reference
Sellers continue the downtrend. This candle's close establishes the price level that will be tested again.
Bullish Middle Candle
A bullish candle that opens below the first candle's close and closes above it, showing buyer interest
Buyers push back against the downtrend. The bullish close above the first candle's close shows emerging demand.
Second Bearish Candle
A bearish candle that closes at approximately the same level as the first candle's close, completing the sandwich
Sellers push price back down but cannot close below the first candle's close level. This double-test creates a support zone.
Psychology
The Stick Sandwich creates a support zone through the matching closes of the two bearish candles. The inability to close below this level twice suggests that demand exists at this price, creating conditions for a reversal.
Buyer Perspective
Buyers recognize the double test of the close level as a potential support zone. The middle bullish candle shows that buying interest exists, encouraging them to step in more aggressively.
Seller Perspective
Sellers drive price down twice but land at the same close level both times, unable to achieve further downside progress. This repeated failure to advance the decline signals exhaustion.
Smart Money Action
Institutions may be placing buy orders at the matching close level, creating a support zone. The repeated return to this level confirms their interest in accumulating at this price.
Retail Trader Trap
Retail traders may see the third bearish candle as confirmation of the downtrend, missing the significance of the matching close and the support it creates.
Emotional Cycle
Trading Strategy
Aggressive Entry
Enter long at the close of the third candle when the matching close level is confirmed.
Conservative Entry
Wait for the fourth candle to close above the third candle's high before entering long.
The first candle's open (the top of the pattern).
1:1 risk-reward or the next resistance level.
2:1 risk-reward or a measured move equal to the pattern height.
Best Conditions
- Timeframe: daily
- Timeframe: 4h
- at support levels
- after moderate downtrends
- in ranging markets
- Asset: stocks
- Asset: forex
Avoid When
- Timeframe: 1m
- Timeframe: 5m
- strong downtrend with momentum
- during panic selling
- bearish macro environment
Confluence Factors
- Matching close level aligns with a key support level
- RSI shows bullish divergence
- Volume declines from the first to the third candle
- Pattern forms near a moving average support
- Fibonacci level aligns with the matching close
Scale In Strategy
Enter half on the pattern completion and add on confirmation from the fourth candle.
Scale Out Strategy
Take half at 1:1 R:R and trail the rest.
Risk Management
Volume Analysis
Volume Confirmation
Declining volume on the third candle compared to the first candle suggests weakening selling pressure.
Volume Profile
Ideally, volume decreases from the first to the third candle, confirming selling exhaustion.
Volume Divergence
If the third candle has higher volume than the first, the selling may not be exhausted.
Technical Confluence
Support Resistance
The matching close level creates a clearly defined support zone that should hold on any retest.
Fibonacci Levels
The matching close aligning with a Fibonacci retracement level significantly increases the pattern's reliability.
Moving Averages
The matching close near the 50 or 200-day moving average adds institutional significance.
Rsi Confirmation
RSI divergence between the first and third candles (price at the same level but RSI higher) is a powerful confirmation.
Macd Confirmation
MACD histogram contraction from the first to the third candle supports the exhaustion thesis.
Bollinger Bands
The pattern forming at the lower Bollinger Band confirms oversold conditions.
Vwap
The matching close near the VWAP creates additional support significance.
Ichimoku Cloud
Pattern forming near the Kijun-sen or Kumo cloud boundary adds confluence.
Elliott Wave
The pattern may appear at the end of corrective waves (Wave 2 or Wave C).
Wyckoff Phase
The matching closes may represent a secondary test within accumulation.
Market Profile
The matching close at the Value Area Low or Point of Control adds significance.
Order Flow
Persistent buy orders at the matching close level visible in the order book confirm demand.
Open Interest
Stable open interest through the pattern confirms no forced liquidation.
Multi-Timeframe Analysis
Higher Timeframe Alignment
Weekly support aligning with a daily stick sandwich provides the strongest signal.
Lower Timeframe Entry
Use the 1-hour chart to time the entry at the matching close level of a daily pattern.
Timeframe Confluence
Weekly support, daily stick sandwich, 4-hour confirmation candle.
Top-Down Approach
Weekly identifies support, daily identifies the pattern, intraday times the entry.
Statistics
Historical Examples
JPM Support Test
successJPM formed a stick sandwich at $110 with two bearish candles closing at $110.50 and a bullish candle in between. The support held and JPM rallied to $120.
Lesson: Bank stocks at institutional support levels can produce reliable stick sandwich patterns.
EUR/GBP Sandwich
partialEUR/GBP formed a stick sandwich near 0.8780. The pattern produced a bounce to 0.8810 before stalling.
Lesson: In forex, the pattern may produce smaller moves — take profits earlier.
Failed Sandwich
failureCOIN appeared to form a stick sandwich but the matching close level broke on the fourth day. Price continued declining sharply.
Lesson: Always wait for confirmation and use the matching close level as your stop. In strong downtrends, the pattern frequently fails.
Variations
Exact Close Match
The two bearish candles close at the exact same price, creating a precise support level.
Approximate Close Match
The closes are within a small tolerance (a few ticks) rather than exact.
Confusion Matrix
Patterns commonly confused with Bullish Stick Sandwich and how to distinguish them.
Bullish Matching Low
7000% similarStick Sandwich has three candles with a bullish middle; Matching Low has just two bearish candles with matching closes.
Key Differences
- Matching Low is a two-candle pattern with two bearish candles sharing the same close
- Stick Sandwich has a bullish candle between the two bearish candles
The Double Bottom is one of the most recognized reversal patterns, forming a W-shape where price tests a support level twice and bounces, signaling that sellers cannot push through and buyers are gaining control.
The Bullish Harami is a two-candle reversal pattern where a small bullish candle is entirely contained within the body of the preceding large bearish candle, signaling a potential end to a downtrend.
The Matching Low is a two-candle bullish reversal pattern where two consecutive bearish candles close at the same price, indicating a support level that sellers cannot breach.
The Bearish Abandoned Baby is one of the rarest and most reliable top reversal patterns in candlestick analysis. It features a doji that is completely isolated by gaps on both sides, signaling an abrupt and dramatic shift from buying to selling pressure.
The Bearish Advance Block shows three consecutive bullish candles with progressively smaller bodies and longer upper shadows, signaling that buying momentum is weakening and a reversal or consolidation is likely.
The Deliberation pattern shows two strong bullish candles followed by a small-bodied third candle, indicating that the uptrend is 'deliberating' — the bulls have stalled and are uncertain about pushing higher.
Pro Tips & Common Mistakes
Pro Tips
- The closer the two bearish candles' closes match, the stronger the support signal
- This is a rare pattern — its rarity increases its significance when it does appear
- Volume should ideally decline from the first to the third candle, confirming selling exhaustion
- Always wait for the confirmation candle — the pattern alone has a moderate failure rate
- Best combined with other support indicators (moving averages, Fibonacci levels) for higher probability
Common Mistakes
- Accepting closes that are not close enough to be considered 'matching'
- Trading the pattern in a strong downtrend without additional confluence
- Entering before the confirmation candle closes above the pattern
- Not using the matching close level as the stop reference
- Ignoring volume — increasing volume on the bearish candles suggests genuine selling, not exhaustion
Advanced Techniques
- Use the matching close level as a future support reference even after the pattern completes
- Combine with options: sell puts at the matching close level to collect premium while expressing the bullish thesis
- Apply volume profile analysis to verify that the matching close level coincides with high-volume nodes
- Use the pattern as part of a larger Wyckoff analysis to identify potential accumulation zones
Institutional Perspective
The matching close level may represent an institutional price target for accumulation. Limit orders at this level absorb selling twice, indicating that a large buyer is systematically accumulating at a specific price.
Fun Facts
- The Stick Sandwich is one of the least commonly occurring candlestick patterns, appearing in less than 1% of chart observations.
- Despite its rarity, the pattern has a dedicated following among Japanese candlestick purists who track matching close levels.
- The 'sandwich' metaphor is one of the more creative food-based analogies in Japanese candlestick naming conventions.
Frequently Asked Questions
A three-candle reversal pattern where two bearish candles with matching closes sandwich a bullish candle. The matching close level creates a support zone that suggests the downtrend may be ending.
The Stick Sandwich is one of the rarer candlestick patterns due to the requirement for matching close prices. This rarity makes it more noteworthy when it appears.
Ideally yes, but in practice a close tolerance (within a few ticks) is acceptable. The closer the match, the stronger the support signal.