Overview
Bullish Three River Bottom
Sansen Soko (三川底)
Also known as: Unique Three River Bottom, Three River Morning Star
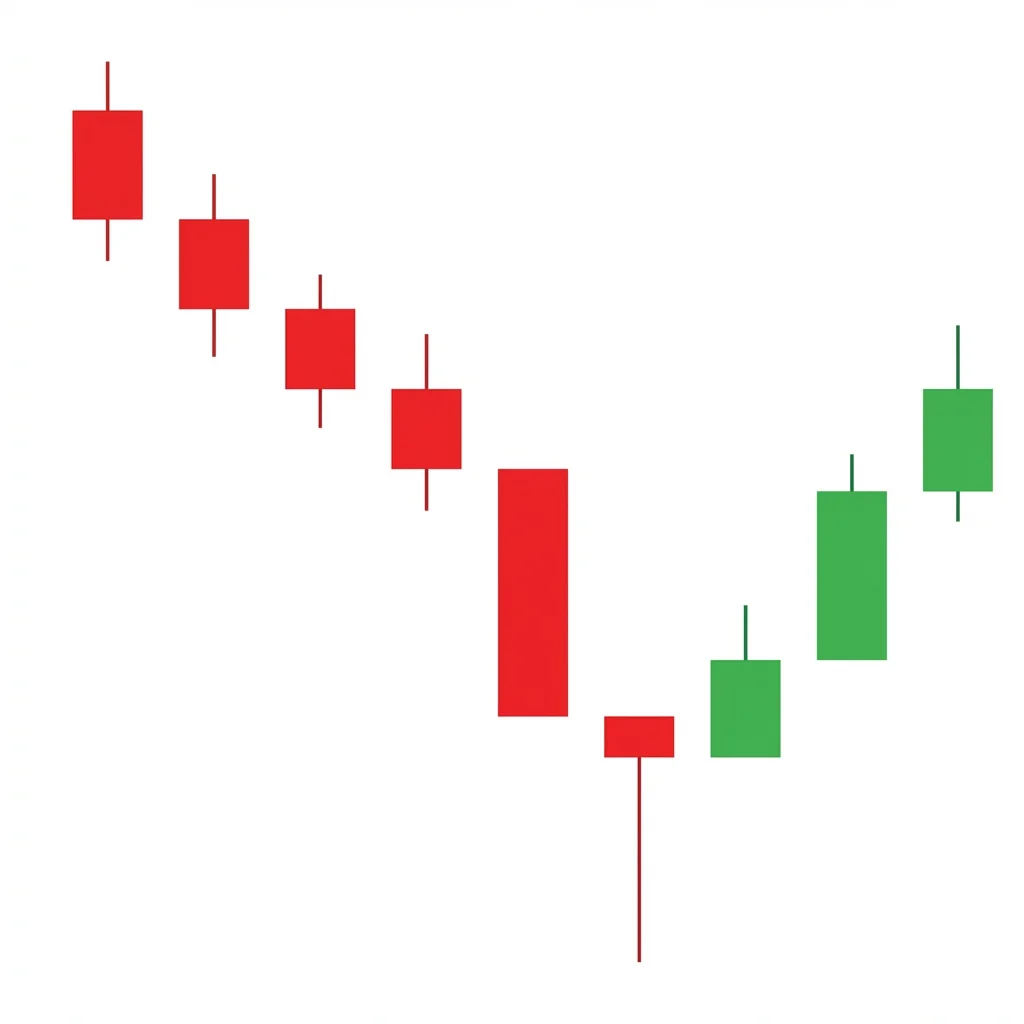
The Bullish Three River Bottom is a rare three-candle reversal pattern where a long bearish candle is followed by a harami-like candle with a long lower shadow that probes new lows, and a small bullish candle that signals the selling has exhausted itself.
This rare pattern combines elements of the harami and the hammer in a unique three-candle structure. The first candle shows strong bearish pressure. The second candle opens within the first candle's body and has a long lower shadow that tests below the first candle's low — probing for the bottom — but closes back within the first candle's range. The third candle is a small bullish candle that closes near the second candle's body, confirming that selling is exhausted. The probe below the first candle's low (the river test) and its failure to hold that level is the key signal.
History & Etymology
The Unique Three River Bottom is one of the rarest patterns in Japanese candlestick analysis. It is documented in comprehensive candlestick references and is considered a variant of the morning star family. The 'three rivers' metaphor comes from Japanese geography and trading culture.
The name 'Three River Bottom' refers to the three candles as three rivers converging at a bottom. In Japanese culture, the confluence of three rivers (sansen) was considered a significant geographic and spiritual landmark.
How It Forms
Formation Steps
- 1First candle: a long bearish candle in a downtrend
- 2Second candle: a candle with a small body that trades within the first candle's range, featuring a long lower shadow that makes a new low
- 3Third candle: a small bullish candle that closes near or below the second candle's body, above the second candle's close
Prerequisites
- Established downtrend
- First candle is long and bearish
- Second candle has a long lower shadow testing new lows
- Third candle is small and bullish, closing within the second candle's range
Confirmation Signals
- Fourth candle closes above the first candle's midpoint
- Volume increases on the confirmation candle
- The new low made by the second candle's shadow is not retested
Invalidation Signals
- Price breaks below the second candle's shadow low
- No follow-through buying after the pattern
- Volume remains heavy on the downside
Candle Breakdown
First Bearish Candle
A long bearish candle establishing strong selling in the downtrend
Bears are in firm control with strong selling conviction.
Probing Candle
A candle within the first candle's range with a long lower shadow testing new lows
Sellers probe for lower prices but are rejected. The long lower shadow shows that buyers absorbed the selling at the new low.
Small Bullish Candle
A small bullish candle closing near the second candle's body level
The small body shows equilibrium, but the bullish close hints at a shift. Selling is exhausted and buyers are emerging.
Psychology
The pattern shows selling exhaustion through a three-stage process: strong selling, a failed test of new lows, and the emergence of tentative buying. The key is the second candle's failed probe below prior lows.
Buyer Perspective
Buyers recognize the failed test of new lows as a sign that the selling is exhausted. They begin placing cautious buy orders.
Seller Perspective
Sellers pushed for new lows on the second candle but were rebuffed. The failure to sustain new lows is demoralizing.
Smart Money Action
Institutions buy the second candle's probe, absorbing the selling at the new low. The small third candle represents their initial accumulation.
Retail Trader Trap
Retail traders may sell the probe to new lows, believing the downtrend is accelerating, and get caught when price reverses.
Emotional Cycle
Trading Strategy
Aggressive Entry
Enter long at the close of the third candle.
Conservative Entry
Wait for the fourth candle to close above the first candle's midpoint.
First candle's open.
1:1 risk-reward.
Previous swing high.
Best Conditions
- Timeframe: daily
- Timeframe: weekly
- at major support
- after extended downtrend
- oversold conditions
- Asset: stocks
- Asset: forex
Avoid When
- Timeframe: 1m
- Timeframe: 5m
- strong bear trend
- no support nearby
- deteriorating fundamentals
Confluence Factors
- Pattern at key support
- RSI divergence
- Second candle's shadow tests a Fibonacci level
- Volume confirms exhaustion
- Oversold stochastic
Scale In Strategy
Enter starter on pattern completion, add on confirmation.
Scale Out Strategy
Take half at first target, trail the rest.
Risk Management
Volume Analysis
Volume Confirmation
Declining volume across the three candles confirms exhaustion.
Volume Profile
Volume spike on the second candle's probe with declining volume on the third.
Volume Divergence
Rising volume on bearish candles suggests the pattern may fail.
Technical Confluence
Support Resistance
The second candle's shadow low creates a strong support reference.
Fibonacci Levels
The shadow testing a Fibonacci level adds significance.
Moving Averages
Pattern near the 200-day MA increases significance.
Rsi Confirmation
RSI divergence between the first and third candles is powerful.
Macd Confirmation
MACD histogram becoming less negative confirms diminishing momentum.
Bollinger Bands
Pattern at the lower Bollinger Band suggests oversold conditions.
Vwap
Pattern near VWAP provides institutional reference.
Ichimoku Cloud
Pattern below cloud with signs of recovery.
Elliott Wave
May appear at Wave C or Wave 5 terminations.
Wyckoff Phase
The probe candle resembles a spring within accumulation.
Market Profile
Second candle testing below the Value Area Low.
Order Flow
Aggressive selling absorbed on the probe with buying emerging.
Open Interest
Declining OI on the probe suggests forced liquidation.
Multi-Timeframe Analysis
Higher Timeframe Alignment
Weekly support with daily Three River Bottom.
Lower Timeframe Entry
Use 4-hour chart to time entry after daily pattern.
Timeframe Confluence
Weekly support, daily pattern, 4-hour confirmation.
Top-Down Approach
Weekly support identification, daily pattern, intraday entry.
Statistics
Historical Examples
DIS River Bottom
successDisney formed a three river bottom at $86 with the second candle probing to $84 before recovering. The reversal produced a rally to $100.
Lesson: In quality stocks at major support with oversold readings, the rare pattern can produce significant reversals.
Partial Recovery
partialNZD/USD formed the pattern near 0.6200. The bounce was modest, reaching 0.6250.
Lesson: In forex, manage expectations for smaller moves.
Failed River Bottom
failureBABA formed what appeared to be a three river bottom but selling continued after geopolitical concerns overwhelmed the technical signal.
Lesson: Fundamental and geopolitical factors can override rare candlestick patterns.
Variations
Deep Probe Version
The second candle's shadow extends significantly below the first candle's low.
Confusion Matrix
Patterns commonly confused with Bullish Three River Bottom and how to distinguish them.
Bullish Morning Star
7000% similarCheck for gaps (morning star) vs containment within the first body (three river). The probing shadow on the second candle is unique to the Three River Bottom.
Key Differences
- Morning star has gaps between candles
- Three River Bottom has the second candle within the first candle's body with a probing lower shadow
The Bullish Harami is a two-candle reversal pattern where a small bullish candle is entirely contained within the body of the preceding large bearish candle, signaling a potential end to a downtrend.
The Morning Doji Star is a three-candle bullish reversal pattern where a bearish candle, a gapped-down doji, and a strong bullish candle combine to signal a decisive bottom — more powerful than the standard Morning Star due to the doji's complete indecision signal.
The Morning Star is a three-candle bullish reversal pattern consisting of a large bearish candle, a small star candle showing indecision, and a large bullish candle confirming the reversal. It is one of the most widely recognized and reliable bottom reversal signals.
The Bearish Abandoned Baby is one of the rarest and most reliable top reversal patterns in candlestick analysis. It features a doji that is completely isolated by gaps on both sides, signaling an abrupt and dramatic shift from buying to selling pressure.
The Bearish Advance Block shows three consecutive bullish candles with progressively smaller bodies and longer upper shadows, signaling that buying momentum is weakening and a reversal or consolidation is likely.
The Deliberation pattern shows two strong bullish candles followed by a small-bodied third candle, indicating that the uptrend is 'deliberating' — the bulls have stalled and are uncertain about pushing higher.
Pro Tips & Common Mistakes
Pro Tips
- This is one of the rarest candlestick patterns — its appearance is noteworthy and should be taken seriously
- The second candle's long lower shadow (probing for the bottom) is the most important element
- Always wait for confirmation — the rarity of the pattern makes false signals more impactful
- Best combined with other reversal signals at major support levels
- The failed test of new lows (the probe) is what distinguishes this from a simple continuation
Common Mistakes
- Not recognizing the pattern due to its rarity
- Entering without confirmation
- Ignoring the second candle's lower shadow — it is the key element
- Placing stops above the second candle's shadow (should be below)
- Trading in isolation without support confluence
Advanced Techniques
- Use the second candle's shadow low as a future support reference
- Combine with Wyckoff spring analysis — the probe resembles a spring test
- Apply volume profile to verify demand at the shadow low
- Use the rarity of the pattern as additional conviction when it does appear
Institutional Perspective
The second candle's probe represents institutional buying at the new low. The failed test of lower prices shows that they absorbed all selling at that level. The small third candle represents the quiet after the institutional buying event.
Fun Facts
- The Three River Bottom is one of the top 5 rarest candlestick patterns, appearing in less than 0.5% of chart formations.
- The 'three rivers' metaphor connects to the historic junction of the Yodo, Katsura, and Uji rivers near Osaka, Japan's historic trading center.
- Some candlestick researchers consider this pattern so rare that there is insufficient data for reliable statistical analysis.
Frequently Asked Questions
A rare three-candle reversal: a long bearish candle, a second candle within its body that probes new lows with a long shadow, and a small bullish candle confirming selling exhaustion.
Extremely rare — one of the least frequently occurring candlestick patterns. Its rarity makes it more significant when it does appear.