Overview
Volatility Contraction
Also known as: VCP, Volatility Contraction Pattern, Tightening Formation, ATR Decline Setup
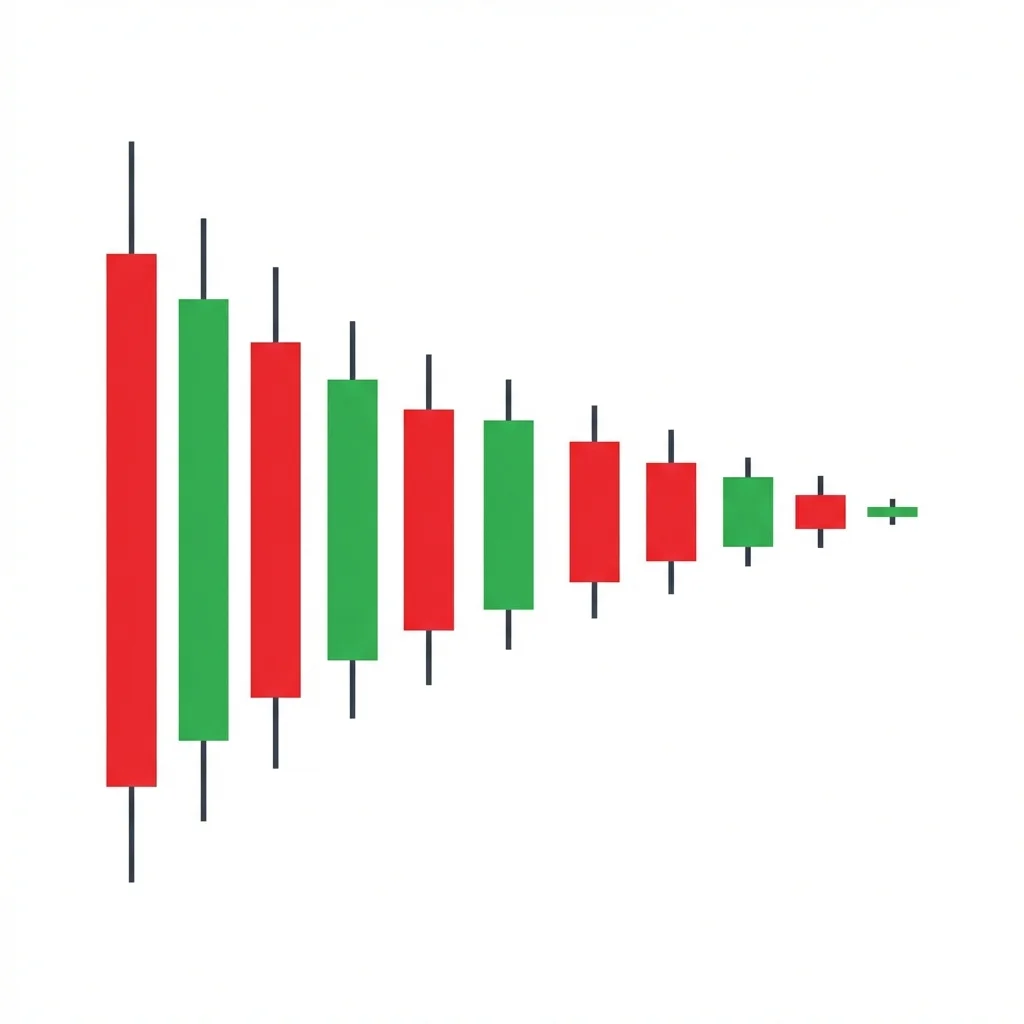
The Volatility Contraction Pattern (VCP) shows progressively smaller price swings as ATR declines, signaling that the market is absorbing supply and preparing for a significant directional breakout.
The Volatility Contraction Pattern is a broader concept than any single candlestick formation — it describes the phenomenon of declining volatility as measured by ATR, standard deviation, or visual swing analysis. The pattern is most famously associated with Mark Minervini's VCP (Volatility Contraction Pattern), which he uses to identify stocks that are being accumulated by institutions. Each successive contraction in swing size shows that selling pressure is being absorbed and the stock is tightening before a move. While the concept applies to all markets, it is most powerful in stocks where institutional accumulation creates the contraction pattern. The breakout from the tightest contraction area typically produces a significant move.
History & Etymology
The Volatility Contraction Pattern was formalized by Mark Minervini, a US Investing Champion, in his books 'Trade Like a Stock Market Wizard' and 'Think and Trade Like a Champion'. While the concept of declining volatility preceding major moves has been known for decades, Minervini's VCP framework provided a systematic approach to identifying and trading these setups.
'Volatility Contraction' directly describes the pattern — volatility (measured by ATR, range, or standard deviation) contracts or declines over time. The 'VCP' abbreviation was coined by Mark Minervini.
How It Forms
Formation Steps
- 1A series of price swings with progressively decreasing amplitude
- 2ATR (Average True Range) declining over the formation period
- 3The overall structure shows contracting volatility from left to right
Prerequisites
- Identifiable reduction in swing size over multiple oscillations
- ATR or historical volatility declining measurably
- Pattern typically forms during a consolidation after a prior move
Confirmation Signals
- A decisive candle breaking out of the contraction zone with expanding volume
- ATR begins to increase (volatility expanding)
- Price closes beyond the most recent contraction boundaries
Invalidation Signals
- Volatility expands without a directional breakout (chaotic expansion)
- The contraction continues beyond the expected timeframe
- No volume increase on the breakout attempt
Candle Breakdown
Contraction Phase Candles
Multiple candles showing progressively smaller swings, with each rally and pullback producing less range than the previous one
Each successive contraction shows that the available supply is being absorbed. Sellers are running out of inventory, and the remaining holders are committed.
Psychology
The Volatility Contraction reflects a gradual exhaustion of one side (typically sellers). Each smaller swing shows less aggressive selling, as the available supply at current prices is being absorbed by patient accumulative buying. The pattern is a visual representation of the supply-demand balance shifting.
Buyer Perspective
Buyers accumulate patiently during each pullback, absorbing selling pressure. Each smaller pullback confirms that fewer sellers remain. They prepare for aggressive buying once the contraction resolves.
Seller Perspective
Sellers initially push price down but find less success with each attempt. The shrinking pullbacks demoralize sellers and confirm that demand is absorbing supply. Weak sellers exit, leaving only committed holders.
Smart Money Action
Institutional traders are the primary creators of volatility contraction patterns. They absorb selling pressure during each pullback, gradually removing supply from the market. The VCP is a visual footprint of institutional accumulation.
Retail Trader Trap
Retail traders sell each pullback within the contraction, not realizing they are selling into institutional demand. By the time the breakout occurs, they are either out of the stock or short.
Emotional Cycle
Trading Strategy
Aggressive Entry
Enter when price breaks above the most recent contraction high (the tightest consolidation area) with volume.
Conservative Entry
Wait for a close above the contraction area high followed by a brief pullback that holds above the breakout level.
Previous swing high or the high of the first contraction.
Measured move based on the depth of the first pullback projected from the breakout.
2x the measured move or the next major resistance level.
Best Conditions
- Timeframe: daily
- Timeframe: weekly
- bull markets for long setups
- stock breakouts
- after corrections in quality names
- Asset: stocks
- Asset: ETFs
- Asset: indices
Avoid When
- Timeframe: 1m
- Timeframe: 5m
- Timeframe: 15m
- bear markets (for long VCP)
- highly volatile crash environments
- illiquid stocks
Confluence Factors
- Stock is showing relative strength (RS line rising)
- The VCP forms after a strong prior uptrend (base breakout)
- Volume dries up during the final contraction
- The stock is in a leading sector
- Earnings growth supports the fundamental thesis
Scale In Strategy
Enter full position on the breakout. Add on the first pullback to the breakout level if it holds.
Scale Out Strategy
Sell one-third at TP1, trail the rest with a moving average stop.
Risk Management
Volume Analysis
Volume Confirmation
Volume should dry up during the contraction and surge on the breakout — this is the most important confirmation.
Volume Profile
Declining volume during each successive contraction, with a dramatic increase on the breakout candle.
Volume Divergence
If volume increases during the contraction without price expansion, it may indicate stealth accumulation.
Technical Confluence
Support Resistance
The contraction boundaries create natural support and resistance levels. The breakout level becomes key support on pullbacks.
Fibonacci Levels
Each contraction pullback often aligns with Fibonacci retracements of the prior rally leg.
Moving Averages
The VCP often forms above the 50 and 200 day moving averages in stocks, confirming the uptrend structure.
Rsi Confirmation
RSI should remain above 40 during the contraction in bullish setups, showing underlying strength.
Macd Confirmation
MACD should be flattening but staying above zero during the contraction for bullish setups.
Bollinger Bands
Bollinger Bands contract during the VCP, confirming the volatility decline.
Vwap
Price consolidating near VWAP during the final contraction shows acceptance at current values.
Ichimoku Cloud
Price above the Kumo cloud during the contraction confirms the bullish structure.
Elliott Wave
VCP can represent a complex Wave 2 or Wave 4 correction before the next impulse wave.
Wyckoff Phase
The VCP maps to the accumulation phase in Wyckoff — each contraction represents another test of supply.
Market Profile
Each contraction creates a narrower value area, leading to an eventual value migration on breakout.
Order Flow
Buy-side absorption visible during pullbacks. Decreasing sell-side aggression confirms supply exhaustion.
Open Interest
In options, rising open interest at call strikes near the breakout level suggests bullish positioning.
Multi-Timeframe Analysis
Higher Timeframe Alignment
A daily VCP within a weekly uptrend provides the highest conviction setups.
Lower Timeframe Entry
After identifying a daily VCP breakout, use the 1-hour chart for precise entry on the breakout or pullback.
Timeframe Confluence
Weekly VCP forming within a monthly uptrend signals a major breakout opportunity.
Top-Down Approach
Monthly trend confirms the secular direction. Weekly/daily VCP identifies the setup. 4-hour provides the entry.
Statistics
Historical Examples
Nvidia VCP Before AI Rally
successNVDA formed a textbook VCP with three contractions of 20%, 12%, and 6% before the AI-driven breakout. The stock rallied from $150 to $480.
Lesson: VCP in leading stocks before paradigm-shifting catalysts can produce life-changing returns.
Meta VCP After Earnings Reset
successMETA formed a VCP after the massive 2022 decline. Each bounce produced smaller pullbacks (75%, 25%, 12%) before the breakout above $130 led to a rally to $300+.
Lesson: VCP after significant corrections in quality companies can mark the start of major recovery rallies.
Speculative Stock VCP Failure
failurePLTR formed what appeared to be a VCP but the breakout failed with low volume. Price reversed back into the contraction zone and eventually broke down.
Lesson: Volume is the critical differentiator. VCP breakouts without volume expansion have a much higher failure rate.
Variations
Cup with Handle VCP
A cup formation followed by a handle that shows volatility contraction characteristics.
Flat Base VCP
A very tight contraction where the stock trades in an extremely narrow range for weeks.
Confusion Matrix
Patterns commonly confused with Volatility Contraction and how to distinguish them.
Neutral Squeeze Breakout
8000% similarSqueeze is indicator-based (Bollinger Bands). VCP is price-structure-based (visual swing analysis). They often overlap.
Key Differences
- Squeeze Breakout is defined by Bollinger Band Width
- Volatility Contraction is defined by progressive swing reduction and ATR decline
Neutral Symmetrical Triangle
6500% similarIf clean trendlines can be drawn, it is a triangle. If the contractions are more irregular but clearly diminishing, it is a VCP.
Key Differences
- Symmetrical Triangle has defined converging trendlines
- VCP is characterized by progressively smaller swings that may not form clean trendlines
A Doji Cluster consists of two or more consecutive doji candles, indicating prolonged indecision and compressed volatility that typically precedes a significant breakout move.
The Squeeze Breakout occurs when volatility compresses to extreme levels (tight Bollinger Bands or low ATR) before an explosive directional move, representing the market's transition from consolidation to trending.
The Symmetrical Triangle is a chart formation where converging trendlines of roughly equal slope create a coiling pattern, indicating a period of equilibrium that will resolve with an explosive breakout in either direction.
The Tight Coil is a multi-candle pattern where each successive candle has a smaller range than the last, creating a coiled-spring effect that typically precedes an explosive directional breakout.
The Broadening Top (Megaphone) is a chart formation characterized by expanding price swings that create higher highs and lower lows, reflecting increasing volatility and instability at market tops before a bearish breakdown.
The Descending Channel is a chart formation where price trends lower within two parallel downward-sloping trendlines, making consistent lower highs and lower lows in an orderly bearish progression.
Pro Tips & Common Mistakes
Pro Tips
- The ideal VCP has 2-4 contractions, each roughly half the depth of the previous one
- Volume drying up in the final contraction is the most important confirmation of supply exhaustion
- Mark Minervini's criteria: stock should be above the 200 MA, RS line rising, and in a Stage 2 uptrend
- The tighter the final contraction, the better the risk-reward ratio on the breakout trade
- Use relative strength (RS line vs. the market) to filter for the strongest VCP setups
Common Mistakes
- Entering before the breakout from the tightest contraction area
- Ignoring volume — breakouts without volume expansion fail at a much higher rate
- Trading VCP in weak stocks that are declining rather than contracting from a position of strength
- Not cutting losses quickly when the breakout fails and price re-enters the contraction zone
- Using the pattern in bear markets for long trades (VCP is most effective in bull markets for longs)
Advanced Techniques
- Use Minervini's Trend Template to filter stocks before applying VCP analysis
- Quantify the contraction ratio (each swing as a percentage of the previous) for systematic screening
- Combine VCP with earnings acceleration and sales growth for fundamental-technical synergy
- Track the stock's relative performance vs. its sector and the market during the contraction for edge
Institutional Perspective
The VCP is a visual representation of institutional accumulation. Funds buy during each pullback, absorbing selling pressure and tightening the pattern. The eventual breakout occurs when supply is exhausted and the institution allows its accumulated position to appreciate. Watch for 13F filings showing increased institutional ownership during VCP formation.
Fun Facts
- Mark Minervini used the VCP as his primary setup to win the US Investing Championship with a 155% return in 2021.
- The VCP concept is based on the Wyckoff principle that institutions must absorb all available supply before a markup phase can begin.
- Statistical analysis of VCP breakouts in stocks with rising relative strength shows a win rate above 70% in bull markets.
Frequently Asked Questions
The VCP is a chart pattern showing progressively smaller price swings with declining ATR, signaling that selling pressure is being absorbed and the stock is tightening for a breakout. It was popularized by Mark Minervini.
The ideal VCP has 2-4 contractions, each roughly half the depth of the previous one. More than 4 contractions may signal exhaustion rather than accumulation.
The VCP is most effective in stocks during bull markets, particularly growth stocks with strong fundamentals. It works in other markets but was designed for stock trading.