Overview
Squeeze Breakout
Also known as: Bollinger Squeeze, Volatility Squeeze, Band Squeeze Breakout
The Squeeze Breakout occurs when volatility compresses to extreme levels (tight Bollinger Bands or low ATR) before an explosive directional move, representing the market's transition from consolidation to trending.
The Squeeze Breakout is an indicator-driven pattern that identifies periods of extreme volatility compression followed by explosive expansion. When Bollinger Bands contract to their narrowest point (a 'squeeze'), it signals that the market has been consolidating energy that must eventually release. The direction of the breakout is unknown until it occurs, making this a neutral setup. The pattern is based on the statistical principle that periods of low volatility are followed by periods of high volatility, and vice versa. Traders use the squeeze to prepare for a significant move without predicting direction, then enter once the breakout direction is confirmed.
History & Etymology
The Squeeze concept was developed by John Bollinger alongside his Bollinger Bands indicator in the 1980s. John Carter later popularized a specific 'TTM Squeeze' indicator that combines Bollinger Bands with Keltner Channels to identify squeeze conditions. The concept of volatility cycling between compression and expansion is a fundamental principle of market behavior.
'Squeeze' describes the visual appearance of Bollinger Bands compressing around price, as if squeezing it into a tighter and tighter range. 'Breakout' refers to the explosive move that follows the compression.
How It Forms
Formation Steps
- 1Bollinger Bands contract to their narrowest width in a defined lookback period
- 2Price action compresses into a tight range with decreasing volatility
- 3A decisive candle breaks out of the compressed range with expanding volume
Prerequisites
- Bollinger Band Width (or Band Width indicator) reaches a multi-period low
- ATR declines to a multi-period low
- Price consolidates within a narrow range
Confirmation Signals
- A strong candle closes outside the Bollinger Bands with expanding volume
- Bollinger Bands begin to expand (Band Width increases)
- Momentum indicators (RSI, MACD) shift decisively in the breakout direction
Invalidation Signals
- Price breaks out but immediately reverses back inside the bands
- No volume expansion on the breakout attempt
- Bands continue to narrow without resolution
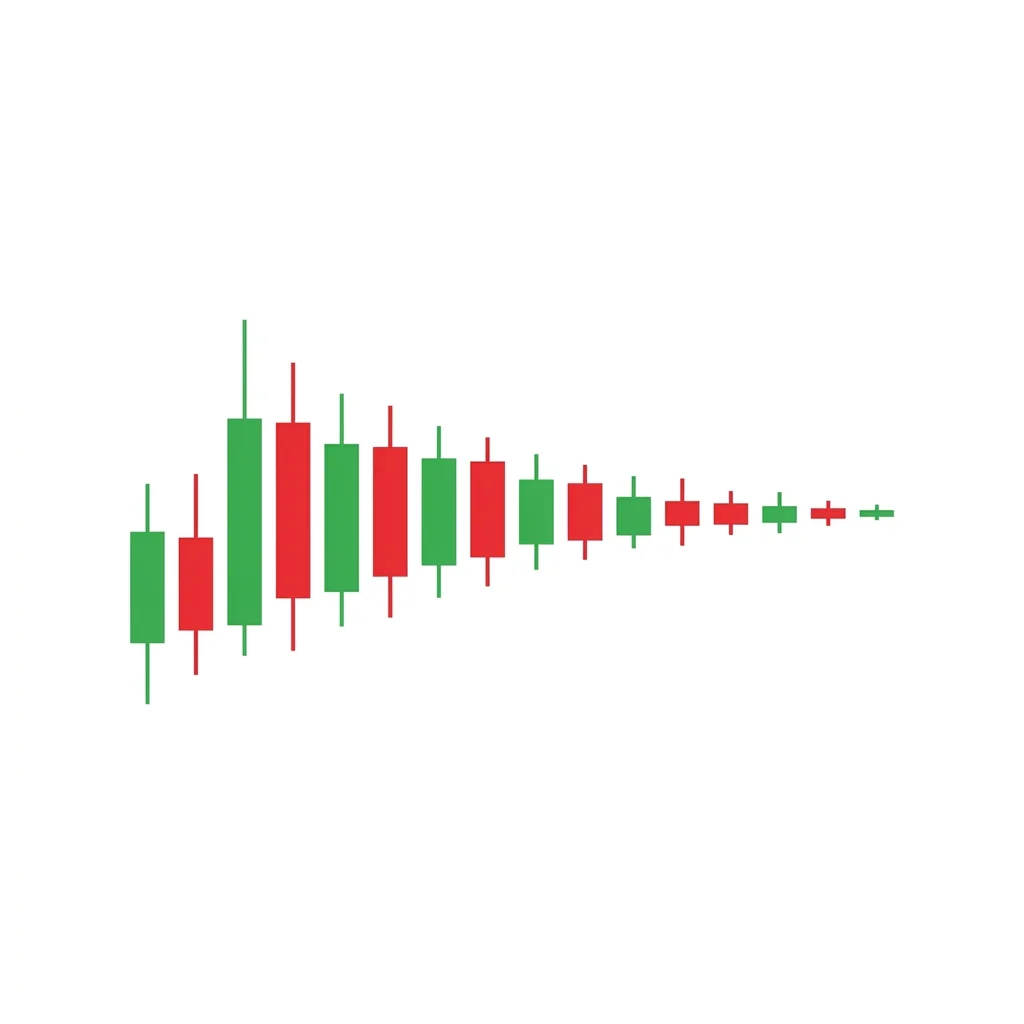
Candle Breakdown
Compression Phase Candles
Multiple candles with decreasing range as volatility compresses, often appearing as spinning tops, doji, or small-range candles
The market is coiling energy. Each session produces less range as buyers and sellers reach tighter equilibrium. Tension builds beneath the surface.
Breakout Candle
A strong directional candle that breaks out of the compressed range with expanding volatility and volume
The coiled spring releases. The first side to gain an advantage triggers a cascade of orders, producing an outsized move relative to recent candle sizes.
Psychology
The Squeeze represents the market's natural breathing cycle — contraction followed by expansion. During the squeeze, participants become complacent as volatility drops. The breakout shocks this complacency, creating a rush of activity as trend-followers pile in and range traders scramble to adjust.
Buyer Perspective
Buyers in a squeeze are cautious, placing small orders within the narrow range. When the breakout occurs upward, they aggressively increase position size, creating buying momentum.
Seller Perspective
Sellers in a squeeze are equally cautious. When the breakout occurs downward, they increase selling pressure. If the breakout is upward, sellers who were short must cover, adding to buying momentum.
Smart Money Action
Institutional traders use the squeeze period to accumulate large positions at favorable prices. The low volatility allows them to build positions without moving the market. They often trigger the breakout once their positions are established.
Retail Trader Trap
Retail traders become bored during the squeeze and either exit positions or reduce their attention. They then chase the breakout at unfavorable prices or miss it entirely.
Emotional Cycle
Trading Strategy
Aggressive Entry
Enter immediately when the first candle closes outside the Bollinger Bands with above-average volume.
Conservative Entry
Wait for the Bollinger Bands to begin expanding (Band Width increasing) and a second candle to confirm the direction.
1.5x the squeeze range projected from the breakout.
Next major support or resistance level.
2-3x the squeeze range or Fibonacci extension level.
Best Conditions
- Timeframe: daily
- Timeframe: 4h
- Timeframe: weekly
- after extended consolidation
- before earnings or major events
- transitioning from range to trend
- Asset: stocks
- Asset: forex
- Asset: crypto
- Asset: futures
Avoid When
- Timeframe: 1m
- Timeframe: 5m
- already trending markets
- flash crash environments
- extremely low liquidity
Confluence Factors
- Keltner Channels inside Bollinger Bands (TTM Squeeze confirmation)
- ATR at multi-period low
- ADX below 20 (indicating no trend)
- Price at a key support or resistance level
- Multiple timeframe squeeze alignment
Scale In Strategy
Enter half on the initial breakout, add the remainder on the first pullback to the broken Bollinger Band.
Scale Out Strategy
Take one-third at TP1, one-third at TP2, trail the final third with the 20 EMA.
Risk Management
Volume Analysis
Volume Confirmation
Volume MUST increase on the breakout candle. Low-volume breakouts from squeezes frequently fail.
Volume Profile
Declining volume during the squeeze with a dramatic surge on breakout is the textbook signature.
Volume Divergence
If volume increases during the squeeze without a breakout, it may signal stealth accumulation/distribution.
Technical Confluence
Support Resistance
Squeeze breakouts from major support/resistance levels produce the most sustained trends.
Fibonacci Levels
Use Fibonacci extensions from the pre-squeeze trend to set targets for the post-squeeze breakout.
Moving Averages
The 20 EMA (Bollinger midline) flattens during the squeeze and begins to slope on breakout, confirming direction.
Rsi Confirmation
RSI near 50 during the squeeze. A move above 60 or below 40 on breakout confirms momentum shift.
Macd Confirmation
MACD histogram near zero during squeeze. Expansion on breakout confirms the momentum release.
Bollinger Bands
The core indicator for this pattern. Band Width at a multi-period low is the primary squeeze signal.
Vwap
The breakout's relationship to VWAP provides an intraday directional clue.
Ichimoku Cloud
Squeeze within or at the Kumo cloud boundary with breakout confirms the Ichimoku trend signal.
Elliott Wave
Squeezes commonly form during Wave 4 consolidations before the Wave 5 impulse.
Wyckoff Phase
The squeeze can represent the final phase of accumulation (before markup) or distribution (before markdown).
Market Profile
The squeeze creates a tight value area. Breakout from value signals value migration and a new trend.
Order Flow
Low delta during the squeeze with a sudden delta explosion on breakout confirms genuine directional conviction.
Open Interest
Rising open interest during the squeeze with stable price suggests position building for the breakout.
Multi-Timeframe Analysis
Higher Timeframe Alignment
A daily squeeze within a weekly squeeze creates the most explosive setups.
Lower Timeframe Entry
After identifying a daily squeeze, use the 1-hour chart for precise breakout entry timing.
Timeframe Confluence
Squeezes on daily, weekly, and 4-hour simultaneously are rare and signal major inflection points.
Top-Down Approach
Weekly squeeze identifies the macro setup. Daily squeeze confirms the timing. 4-hour provides the entry.
Statistics
Historical Examples
GameStop Squeeze Before Short Squeeze
successGME's Bollinger Bands contracted to their tightest level in months before the historic short squeeze. The breakout above the upper band initiated a move from $20 to $480.
Lesson: Squeeze breakouts in stocks with high short interest can produce extraordinary moves.
EUR/USD Weekly Squeeze
successEUR/USD weekly Bollinger Bands squeezed to multi-year lows near parity. The bearish breakout below the lower band led to a continuation toward 0.9535.
Lesson: Weekly squeeze breakouts produce sustained trends that can last months.
Bitcoin Daily Squeeze False Break
failureBTC's Bollinger Bands squeezed near $28,000. The initial upside breakout reversed within two candles, trapping breakout buyers.
Lesson: Even squeeze breakouts can fail. Volume confirmation and a second candle close are important for validation.
Variations
TTM Squeeze
John Carter's refined squeeze using Keltner Channels inside Bollinger Bands as the trigger.
Double Squeeze
A squeeze that occurs on multiple timeframes simultaneously.
Confusion Matrix
Patterns commonly confused with Squeeze Breakout and how to distinguish them.
Neutral Volatility Contraction
8500% similarSqueeze Breakout is the specific Bollinger Band implementation. Volatility Contraction is the general principle.
Key Differences
- Squeeze Breakout specifically references Bollinger Bands
- Volatility Contraction is a broader concept based on ATR decline
Neutral Tight Coil
7000% similarTight Coil is defined by candle structure. Squeeze Breakout is defined by Bollinger Band Width.
Key Differences
- Tight Coil is a candlestick pattern with shrinking ranges
- Squeeze Breakout is an indicator-based setup using Bollinger Bands
A Doji Cluster consists of two or more consecutive doji candles, indicating prolonged indecision and compressed volatility that typically precedes a significant breakout move.
The Inside Bar is a two-candle pattern where the second candle's entire range is contained within the first candle, signaling a contraction in volatility and a pending breakout in either direction.
The Tight Coil is a multi-candle pattern where each successive candle has a smaller range than the last, creating a coiled-spring effect that typically precedes an explosive directional breakout.
The Volatility Contraction Pattern (VCP) shows progressively smaller price swings as ATR declines, signaling that the market is absorbing supply and preparing for a significant directional breakout.
The Broadening Top (Megaphone) is a chart formation characterized by expanding price swings that create higher highs and lower lows, reflecting increasing volatility and instability at market tops before a bearish breakdown.
The Descending Channel is a chart formation where price trends lower within two parallel downward-sloping trendlines, making consistent lower highs and lower lows in an orderly bearish progression.
Pro Tips & Common Mistakes
Pro Tips
- The TTM Squeeze (Keltner Channels inside Bollinger Bands) provides more precise squeeze identification than Bollinger Bands alone
- The longer the squeeze persists, the more explosive the eventual breakout — track squeeze duration
- Volume is the most critical confirmation factor — never enter a squeeze breakout without volume expansion
- Use ADX below 20 to confirm the squeeze condition and ADX above 25 to confirm the breakout
- Multiple timeframe squeeze alignment (e.g., daily and weekly both squeezed) produces the most powerful moves
Common Mistakes
- Entering during the squeeze in anticipation of the breakout direction
- Trading low-volume breakouts from squeezes — these fail frequently
- Not adjusting position size after the squeeze (ATR will be at a low, making stops seem tight)
- Ignoring the squeeze setup because Bollinger Bands seem boring during consolidation
- Expecting immediate follow-through — some breakouts retest the squeeze zone before continuing
Advanced Techniques
- Combine the TTM Squeeze with the Squeeze Momentum Oscillator to gauge breakout direction before entry
- Use options implied volatility rank (IVR) to confirm low volatility and buy options before the expansion
- Apply machine learning models to identify squeeze conditions and predict breakout direction based on historical patterns
- Use the squeeze duration as a multiplier for the expected breakout magnitude
Institutional Perspective
Institutional traders specifically scan for squeeze setups as they represent the highest probability trend initiation points. The low-volatility environment allows them to build positions with minimal market impact. Many institutional algorithms are calibrated to increase position size when squeeze conditions are detected.
Fun Facts
- John Carter's TTM Squeeze indicator has become one of the most popular retail trading indicators, with millions of users worldwide.
- Statistical analysis shows that a Bollinger Band Width at a 6-month low is followed by a move of at least 2 standard deviations within the next 20 bars roughly 80% of the time.
- The squeeze-breakout cycle mirrors the scientific concept of elastic potential energy — the more compressed, the more explosive the release.
Frequently Asked Questions
A Squeeze Breakout occurs when Bollinger Bands contract to their narrowest width (indicating low volatility) and then price breaks out of the compressed range with expanded volume, signaling the start of a new trend.
Look for Bollinger Band Width at a multi-period low, ATR declining, and price trading in a narrow range. The TTM Squeeze indicator also plots when Keltner Channels are inside Bollinger Bands.
The direction is unknown during the squeeze. Wait for the breakout and use volume confirmation. The prior trend direction has a slight statistical edge for continuation.