Overview
Northern Doji
Also known as: Uptrend Doji, Top Doji, Doji at Highs
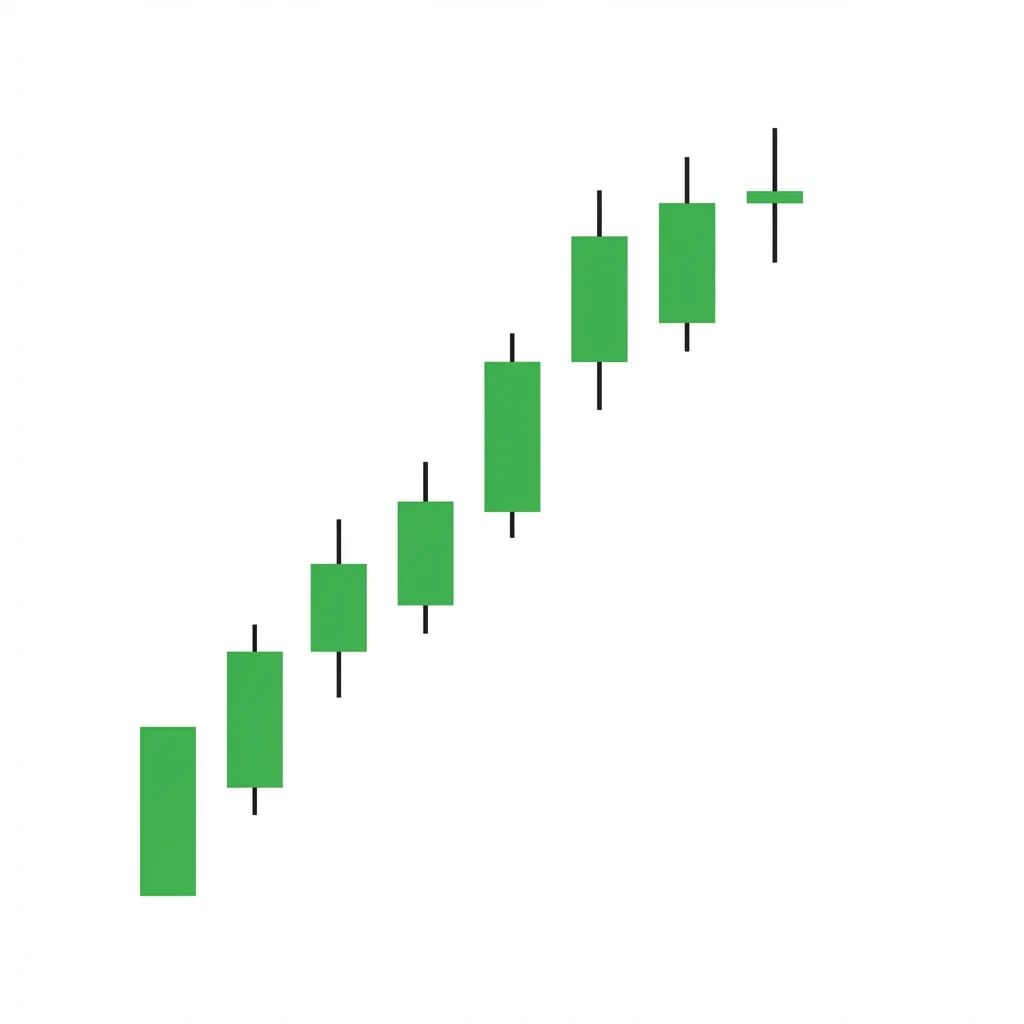
The Northern Doji appears after an uptrend and signals that buying momentum may be exhausting. While it warns of potential reversal, it can also be a pause before continuation, making it a neutral alert rather than a directional signal.
The Northern Doji is context-specific — it is any doji that appears after an uptrend, positioned in the 'northern' or upper territory of the price chart. The doji itself shows that after a sustained rally, buyers and sellers reached equilibrium during the session. This is significant because it breaks the pattern of bullish dominance that defined the uptrend. The Northern Doji warns that the buying momentum may be fading, but it does not guarantee a reversal. Many uptrends pause at doji candles before continuing higher. The key is to wait for confirmation from subsequent price action rather than acting on the doji alone.
History & Etymology
The Northern Doji concept comes from the positional analysis approach in Japanese candlestick theory, where the same candle formation has different implications depending on its location within the price structure. The 'northern' designation indicates the doji's position at the top of a move.
'Northern' refers to the top position on the price chart (in Japanese candlestick orientation, north is up). The doji at this location signals a potential shift from bullish to uncertain conditions.
How It Forms
Formation Steps
- 1A standard doji candle (open and close nearly identical)
- 2Appears after an established uptrend or rally
- 3Located in the upper range of recent price action
Prerequisites
- Clear prior uptrend of at least several bars
- Doji forms at or near the high of the uptrend
- Open and close are virtually identical
Confirmation Signals
- Bearish candle following the doji, closing below the doji low
- Gap down on the next session
- Increasing volume on bearish follow-through
Invalidation Signals
- Strong bullish candle closing above the doji high
- Continued uptrend with higher highs
- The doji was merely a pause before continuation
Candle Breakdown
Northern Doji
A doji candle appearing after an uptrend, at or near the recent price highs, where buying momentum has stalled
After sustained buying pushed prices higher, buyers and sellers reached a standoff. The doji breaks the bullish rhythm and alerts that the easy upside may be over.
Psychology
The Northern Doji reflects a psychological shift from bullish confidence to uncertainty. After an uptrend where buyers dominated session after session, the doji shows that sellers have finally stepped up enough to prevent further gains. This moment of equilibrium at elevated prices is a warning flag.
Buyer Perspective
Buyers who drove the uptrend see the doji as a pause. Some take profits, others hold waiting for continuation. The uncertainty reduces new buying pressure.
Seller Perspective
Sellers who have been watching the rally gain confidence from the stall. The doji validates their thesis that the rally may be overextended, encouraging new short positions.
Smart Money Action
Institutional traders often begin distributing (selling) their long positions during Northern Doji sessions. The indecision provides cover for large sell orders without causing an immediate crash.
Retail Trader Trap
Retail traders who chased the uptrend and bought near the top see the doji as a minor pause and hold. They are most vulnerable to a subsequent reversal.
Emotional Cycle
Trading Strategy
Aggressive Entry
Short at the close of the Northern Doji with a stop above the doji high.
Conservative Entry
Wait for a bearish candle closing below the doji's low on the next session before shorting.
The first significant support level or pullback target.
The 50% retracement of the prior uptrend.
The 61.8% Fibonacci retracement of the entire uptrend.
Best Conditions
- Timeframe: daily
- Timeframe: 4h
- Timeframe: weekly
- extended uptrends at overbought levels
- at resistance
- after parabolic moves
- Asset: stocks
- Asset: indices
- Asset: crypto
Avoid When
- Timeframe: 1m
- Timeframe: 5m
- Timeframe: 15m
- strong uptrends with fundamental catalysts
- in the early stages of a bull run
Confluence Factors
- RSI is overbought (above 70)
- Northern Doji forms at a major resistance level
- Volume has been declining during the uptrend
- Bearish divergence on MACD or RSI
- Price is at a Bollinger Band upper extreme
Scale In Strategy
Short a small position at the doji close, add on bearish confirmation candle close below the doji low.
Scale Out Strategy
Cover one-third at TP1, one-third at TP2, trail the remainder.
Risk Management
Volume Analysis
Volume Confirmation
Volume should be average or declining on the doji (fatigue). Increasing volume on a bearish follow-through confirms distribution.
Volume Profile
Declining volume during the final stages of the uptrend into the doji suggests exhaustion.
Volume Divergence
If the uptrend showed declining volume approaching the doji, the exhaustion thesis is strengthened.
Technical Confluence
Support Resistance
Northern Doji at established resistance dramatically increases the reversal probability.
Fibonacci Levels
If the uptrend reaches a Fibonacci extension level (127.2% or 161.8%) and prints a Northern Doji, the reversal is likely.
Moving Averages
Northern Doji after price has moved far above the 20 EMA suggests mean reversion is pending.
Rsi Confirmation
RSI above 70 with a Northern Doji creates a textbook overbought reversal setup.
Macd Confirmation
MACD bearish divergence (price making higher highs while MACD makes lower highs) at the Northern Doji adds conviction.
Bollinger Bands
Northern Doji at or above the upper Bollinger Band signals overextension and likely mean reversion.
Vwap
Price significantly above VWAP during the Northern Doji session suggests the rally is stretched.
Ichimoku Cloud
Northern Doji far above the Kumo cloud with a wide Tenkan-Kijun gap suggests overextension.
Elliott Wave
Northern Doji frequently marks the end of Wave 3 or Wave 5 in Elliott Wave analysis.
Wyckoff Phase
May represent the Buying Climax or Automatic Rally phase in Wyckoff distribution.
Market Profile
Northern Doji at the upper edge of the value area indicates the market is testing for acceptance at higher prices.
Order Flow
Decreasing aggressive buy orders with increasing passive sell orders at the doji level signal distribution.
Open Interest
Rising open interest at the doji level may indicate new short positions being established.
Multi-Timeframe Analysis
Higher Timeframe Alignment
A daily Northern Doji at a weekly resistance level is a high-probability reversal setup.
Lower Timeframe Entry
After a daily Northern Doji, use the 4-hour chart to identify a bearish pattern for short entry timing.
Timeframe Confluence
Northern Doji on both daily and weekly charts signals a major inflection point.
Top-Down Approach
Monthly/weekly trend context determines if the Northern Doji is a major top or a minor pause. Daily provides the signal.
Statistics
Historical Examples
S&P 500 Northern Doji at All-Time High
successSPX printed a Northern Doji at its all-time high near 4,818. The market reversed and began a correction that lasted several months.
Lesson: Northern Doji at all-time highs with RSI overbought is one of the most reliable exhaustion signals.
Tesla Northern Doji During Rally
failureTSLA formed a Northern Doji at $290 during its 2023 rally. Price paused briefly but then continued higher to $300+.
Lesson: Not every Northern Doji leads to a reversal. In strong momentum moves, it may just be a rest day.
Bitcoin Northern Doji Before Pullback
successBTC formed a Northern Doji at $31,000 after a strong rally. The next week saw a pullback to $27,000.
Lesson: Northern Doji at round numbers that coincide with resistance levels have higher reversal probability.
Variations
Northern Long-Legged Doji
A long-legged doji appearing at the top of an uptrend, combining position and extreme indecision.
Northern Doji Star
A doji that gaps up from the prior candle during an uptrend, creating an even stronger exhaustion signal.
Confusion Matrix
Patterns commonly confused with Northern Doji and how to distinguish them.
Neutral Southern Doji
5000% similarCheck the prior trend. If the doji appears at the top of an uptrend, it is Northern. If at the bottom of a downtrend, it is Southern.
Key Differences
- Southern Doji appears after a downtrend
- Northern Doji appears after an uptrend
- They lean in opposite directional contexts
Neutral Doji
9000% similarA Northern Doji is simply a doji classified by its position at the top of an uptrend. The candle formation is the same.
Key Differences
- Standard Doji is context-independent
- Northern Doji specifically requires a prior uptrend
The Evening Doji Star is a top-tier three-candle bearish reversal pattern. The doji in the star position represents the pivot point between bullish confidence (first candle) and bearish dominance (third candle), making it one of the most reliable reversal signals in candlestick analysis.
The hanging man is a single-candle bearish reversal pattern with a small body at the top and a long lower shadow, appearing at the top of an uptrend. It warns that selling pressure is emerging despite the continued uptrend.
The shooting star is a single-candle bearish reversal pattern with a small body near the low and a long upper shadow. It shows that buyers pushed price significantly higher during the session but sellers drove it back down, signaling a potential top.
The Doji is the quintessential indecision candle where opening and closing prices are virtually identical, reflecting a perfect tug-of-war between buyers and sellers.
The High Wave candle features a small body with extremely long upper and lower shadows, signaling intense intraday volatility and extreme indecision that often precedes a significant directional move.
The Southern Doji appears after a downtrend and signals that selling momentum may be exhausting. While it warns of potential reversal, it can also be a pause before continuation lower, making it a neutral alert requiring confirmation.
Pro Tips & Common Mistakes
Pro Tips
- Not every Northern Doji leads to a reversal — many uptrends pause at doji candles and continue higher
- The strongest Northern Doji signals occur at resistance levels with overbought RSI and declining volume
- Use the Northern Doji as an alert to tighten stops on long positions rather than immediately shorting
- The longer the preceding uptrend, the more significant the Northern Doji becomes
- Multiple Northern Doji in close proximity dramatically increase the reversal probability
Common Mistakes
- Automatically shorting every Northern Doji without confirmation
- Ignoring that doji in strong uptrends are often just pauses, not reversals
- Placing short entries before the next candle confirms the bearish bias
- Failing to consider the fundamental backdrop — strong fundamentals may override the technical signal
- Using the Northern Doji alone without supporting indicators
Advanced Techniques
- Use the Northern Doji as a trigger to convert long positions to a trailing stop approach
- Combine with options — buy puts at the doji level to hedge long equity exposure
- Monitor the breadth indicators on the doji day — if breadth is deteriorating while price makes new highs, the reversal probability increases
- Use sector rotation analysis — if the Northern Doji appears in late-cycle sectors, it confirms the rotation thesis
Institutional Perspective
Institutional traders use Northern Doji sessions to distribute (sell) long positions accumulated at lower levels. The indecision candle provides cover for large sell orders without triggering alarm. Watch for unusual dark pool activity on Northern Doji days.
Fun Facts
- The Northern/Southern doji classification demonstrates how the same candlestick formation can have opposite implications depending on context.
- Studies show that Northern Doji at all-time highs have a 60%+ probability of a pullback of at least 2% within 5 days.
- The Northern Doji is the mirror image of the Southern Doji, representing the yin-yang nature of market cycles in Japanese trading philosophy.
Frequently Asked Questions
A Northern Doji is a doji candle that appears after an uptrend, positioned at the 'northern' (high) end of the price chart. It signals that the uptrend's momentum may be exhausting.
No. Many Northern Doji are simply pauses in strong uptrends. Confirmation from subsequent bearish price action is required before treating it as a reversal signal.
Use it as an alert to tighten stops on longs and watch for bearish confirmation. Only initiate shorts after the next candle confirms with a close below the doji's low.