Overview
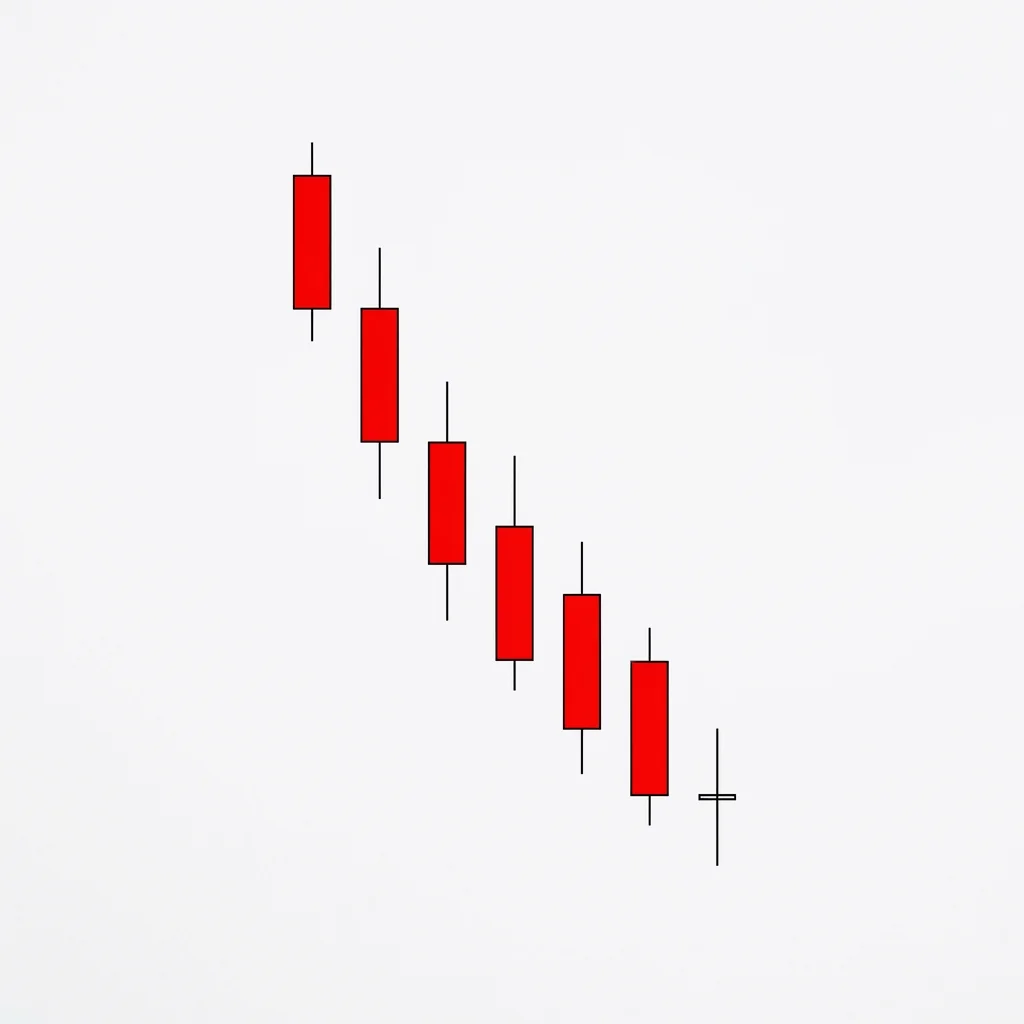
Southern Doji
Also known as: Downtrend Doji, Bottom Doji, Doji at Lows
The Southern Doji appears after a downtrend and signals that selling momentum may be exhausting. While it warns of potential reversal, it can also be a pause before continuation lower, making it a neutral alert requiring confirmation.
The Southern Doji is the positional counterpart to the Northern Doji — a standard doji that appears after a downtrend, positioned in the 'southern' or lower territory of the price chart. The doji shows that after sustained selling, buyers and sellers reached equilibrium. This is notable because it interrupts the pattern of bearish dominance that defined the downtrend. The Southern Doji warns that selling pressure may be fading, but it does not guarantee a reversal. Many downtrends pause at doji candles before continuing lower. The pattern becomes a strong bullish signal only when combined with supporting indicators and confirmed by subsequent buying.
History & Etymology
Like the Northern Doji, the Southern Doji concept comes from Japanese candlestick positional analysis. The same doji formation carries different weight depending on its position within the price structure. At the bottom of declines, the doji was seen as the first sign of balance returning after bearish domination.
'Southern' refers to the bottom position on the price chart (south is down in chart orientation). The doji at this location signals a potential shift from bearish to uncertain conditions.
How It Forms
Formation Steps
- 1A standard doji candle (open and close nearly identical)
- 2Appears after an established downtrend or decline
- 3Located in the lower range of recent price action
Prerequisites
- Clear prior downtrend of at least several bars
- Doji forms at or near the low of the downtrend
- Open and close are virtually identical
Confirmation Signals
- Bullish candle following the doji, closing above the doji high
- Gap up on the next session
- Increasing volume on bullish follow-through
Invalidation Signals
- Strong bearish candle closing below the doji low
- Continued downtrend with lower lows
- The doji was merely a pause before further decline
Candle Breakdown
Southern Doji
A doji candle appearing after a downtrend, at or near recent price lows, where selling momentum has stalled
After sustained selling pushed prices lower, the market reached a point where buyers matched sellers exactly. This equilibrium breaks the bearish rhythm and alerts that the easy downside may be over.
Psychology
The Southern Doji reflects a shift from bearish confidence to uncertainty. After a downtrend where sellers dominated, the doji shows that buyers have finally mustered enough strength to neutralize selling pressure. This moment of equilibrium at depressed prices is a potential turning point.
Buyer Perspective
Buyers who have been waiting for a bottoming signal see the doji as evidence that selling pressure is waning. They may begin cautiously accumulating positions, especially if the doji forms at key support.
Seller Perspective
Sellers who profited from the downtrend see the stall as a potential warning. Some begin covering shorts, while others wait to see if the decline resumes. The doji introduces doubt.
Smart Money Action
Institutional traders use Southern Doji sessions to begin accumulating long positions. The low prices and equilibrium provide an opportunity to build positions before a potential reversal without causing a premature spike.
Retail Trader Trap
Retail traders who sold short during the downtrend may hold through the doji, expecting continuation. If the doji leads to a reversal, they are caught in a short squeeze.
Emotional Cycle
Trading Strategy
Aggressive Entry
Buy at the close of the Southern Doji with a stop below the doji low.
Conservative Entry
Wait for a bullish candle closing above the doji's high on the next session before entering long.
The first significant resistance level or pullback target.
The 50% retracement of the prior downtrend.
The 61.8% Fibonacci retracement of the decline.
Best Conditions
- Timeframe: daily
- Timeframe: 4h
- Timeframe: weekly
- extended downtrends at oversold levels
- at support
- after capitulation selling
- Asset: stocks
- Asset: indices
- Asset: crypto
Avoid When
- Timeframe: 1m
- Timeframe: 5m
- Timeframe: 15m
- strong downtrends with fundamental deterioration
- bear market crashes
Confluence Factors
- RSI is oversold (below 30)
- Southern Doji forms at a major support level
- Volume has been declining during the downtrend
- Bullish divergence on MACD or RSI
- Price is at or below the lower Bollinger Band
Scale In Strategy
Buy a small position at the doji close, add on bullish confirmation candle close above the doji high.
Scale Out Strategy
Sell one-third at TP1, one-third at TP2, trail the remainder.
Risk Management
Volume Analysis
Volume Confirmation
Volume should be average or declining on the doji (selling exhaustion). Rising volume on a bullish follow-through confirms accumulation.
Volume Profile
Declining volume during the final stages of the downtrend into the doji suggests selling exhaustion.
Volume Divergence
If the downtrend showed declining volume approaching the doji, the exhaustion thesis is strengthened.
Technical Confluence
Support Resistance
Southern Doji at established support dramatically increases the reversal probability.
Fibonacci Levels
If the downtrend reaches a Fibonacci retracement level (50% or 61.8%) and prints a Southern Doji, a bounce is likely.
Moving Averages
Southern Doji near a major moving average (50 or 200 day) from below suggests the MA may provide support.
Rsi Confirmation
RSI below 30 with a Southern Doji creates a textbook oversold reversal setup.
Macd Confirmation
MACD bullish divergence (price making lower lows while MACD makes higher lows) at the Southern Doji strengthens the signal.
Bollinger Bands
Southern Doji at or below the lower Bollinger Band signals overextension and potential mean reversion.
Vwap
Price significantly below VWAP during the Southern Doji session suggests the sell-off is stretched.
Ichimoku Cloud
Southern Doji far below the Kumo cloud with potential Tenkan-Kijun crossover approaching.
Elliott Wave
Southern Doji frequently marks the end of Wave 5 down or Wave C of a correction.
Wyckoff Phase
May represent the Selling Climax (SC) or Secondary Test (ST) in Wyckoff accumulation.
Market Profile
Southern Doji at the lower edge of the value area indicates the market is testing for acceptance at lower prices.
Order Flow
Decreasing aggressive sell orders with emerging buy-side absorption at the doji level signal accumulation.
Open Interest
Declining open interest at the doji level suggests sellers are covering rather than adding.
Multi-Timeframe Analysis
Higher Timeframe Alignment
A daily Southern Doji at a weekly support level is a high-probability reversal setup.
Lower Timeframe Entry
After a daily Southern Doji, use the 4-hour chart to identify a bullish pattern for long entry timing.
Timeframe Confluence
Southern Doji on both daily and weekly charts signals a major potential bottom.
Top-Down Approach
Monthly/weekly context determines if the Southern Doji is a major bottom or a minor bounce.
Statistics
Historical Examples
S&P 500 Southern Doji at COVID Low
successSPX printed a Southern Doji near the COVID crash lows at 2,191. This marked the exact bottom, and the market rallied over 100% from this level.
Lesson: Southern Doji during extreme fear at major support can mark generational buying opportunities.
Ethereum Southern Doji During Bear Market
partialETH formed a Southern Doji near $880 during the crypto bear market. Price bounced to $2,000 but the broader bear trend continued.
Lesson: Southern Doji in bear markets can signal tradable bounces but not necessarily the final bottom.
USD/JPY Southern Doji Failure
failureUSD/JPY formed a Southern Doji at 127.50 but the next session continued lower to 125.00 before finding support.
Lesson: In strong downtrends, Southern Doji often mark temporary pauses rather than reversals. Wait for confirmation.
Variations
Southern Long-Legged Doji
A long-legged doji at the bottom of a downtrend, combining position and extreme indecision.
Southern Doji Star
A doji that gaps down from the prior candle during a downtrend, creating an even stronger exhaustion signal.
Confusion Matrix
Patterns commonly confused with Southern Doji and how to distinguish them.
Neutral Northern Doji
5000% similarCheck the prior trend. If at the bottom of a downtrend, it is Southern. If at the top of an uptrend, it is Northern.
Key Differences
- Northern Doji appears after an uptrend
- Southern Doji appears after a downtrend
- They lean in opposite directional contexts
Neutral Doji
9000% similarA Southern Doji is simply a doji classified by its position at the bottom of a downtrend.
Key Differences
- Standard Doji is context-independent
- Southern Doji specifically requires a prior downtrend
The Morning Doji Star is a three-candle bullish reversal pattern where a bearish candle, a gapped-down doji, and a strong bullish candle combine to signal a decisive bottom — more powerful than the standard Morning Star due to the doji's complete indecision signal.
The Doji is the quintessential indecision candle where opening and closing prices are virtually identical, reflecting a perfect tug-of-war between buyers and sellers.
The High Wave candle features a small body with extremely long upper and lower shadows, signaling intense intraday volatility and extreme indecision that often precedes a significant directional move.
The Northern Doji appears after an uptrend and signals that buying momentum may be exhausting. While it warns of potential reversal, it can also be a pause before continuation, making it a neutral alert rather than a directional signal.
The Bearish Belt Hold is a single bearish candle that opens at its high and closes near its low with a long body, indicating that sellers dominated from the opening bell and controlled price action throughout the session.
The Bearish Closing Marubozu is a single bearish candle with no lower shadow — the close is at the exact low of the session. This indicates that sellers controlled the session and maintained pressure through the very last trade, a sign of strong bearish conviction.
Pro Tips & Common Mistakes
Pro Tips
- Not every Southern Doji leads to a reversal — strong downtrends frequently pause and then continue lower
- The strongest Southern Doji signals occur at support with oversold RSI and bullish divergence
- Use the Southern Doji as an alert to cover shorts or tighten bearish stops rather than immediately buying
- The longer the preceding downtrend, the more significant the Southern Doji becomes
- Volume analysis is crucial — declining volume into the doji supports the exhaustion thesis
Common Mistakes
- Catching a falling knife by buying every Southern Doji without confirmation
- Ignoring that doji in strong downtrends are often just pauses before further declines
- Placing long entries before the next candle confirms the bullish bias
- Averaging down into a Southern Doji without a defined stop loss
- Using the Southern Doji alone without supporting technical indicators
Advanced Techniques
- Use the Southern Doji as a trigger to convert short positions to a trailing stop approach
- Combine with put/call ratio data — extreme put buying at the Southern Doji level confirms capitulation
- Monitor breadth indicators — if breadth is improving at the Southern Doji, the reversal thesis strengthens
- Use sector rotation analysis — if defensive sectors are outperforming, the broader bottom may not be in
Institutional Perspective
Institutional traders use Southern Doji sessions to begin accumulating long positions in fundamentally sound assets. The indecision provides cover for large buy orders without immediately driving price higher. Watch for dark pool prints and unusual options activity.
Fun Facts
- The Southern Doji at the March 2020 COVID crash low on the S&P 500 preceded one of the fastest market recoveries in history.
- Statistical studies show that Southern Doji with volume capitulation (spike followed by decline) have a 65% probability of marking at least a short-term bottom.
- The Northern/Southern doji pair exemplifies the Japanese philosophical concept that the same phenomenon can have opposite meanings depending on perspective.
Frequently Asked Questions
A Southern Doji is a doji candle that appears after a downtrend, at the 'southern' (low) end of the price chart. It signals that selling momentum may be exhausting.
No. Many Southern Doji are pauses in downtrends. Confirmation from subsequent bullish price action is required before treating it as a reversal signal.
Use it as an alert to cover shorts and watch for bullish confirmation. Only initiate longs after the next candle confirms with a close above the doji's high.