Overview
Bearish Pennant
Also known as: Bear Pennant, Continuation Pennant Down, Bearish Flag Pennant
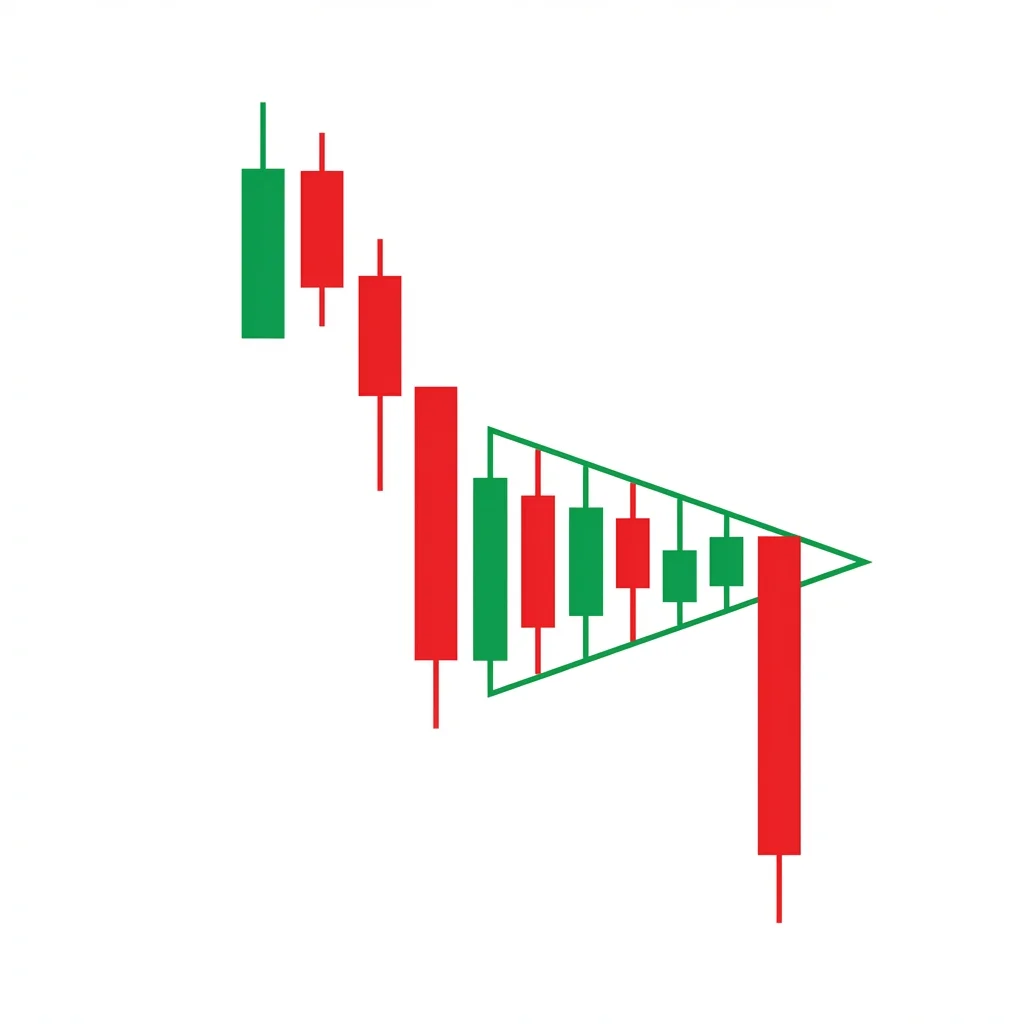
A bearish pennant is a continuation pattern that forms after a sharp decline, creating a small symmetrical triangle as the market consolidates before resuming its downward move. The measured target equals the flagpole's length projected from the breakout point.
The bearish pennant is a reliable continuation pattern that appears during strong downtrends. It consists of two parts: the flagpole (a sharp, steep decline) and the pennant (a small symmetrical triangle formed by converging trendlines). The pennant represents a brief pause where the market catches its breath after an aggressive sell-off. During this consolidation, volume typically contracts, reflecting diminishing buying interest. When price breaks below the lower trendline of the pennant on expanding volume, it signals that the downtrend is resuming. The measured move target is calculated by projecting the flagpole's length downward from the breakout point. Bearish pennants tend to resolve relatively quickly—typically within 1-3 weeks on daily charts.
History & Etymology
Pennant patterns have been documented in technical analysis literature since the 1930s, with Schabacker and later Edwards and Magee providing detailed descriptions. The pattern is derived from military flag terminology, as the consolidation shape resembles a military pennant hanging from a pole.
The name 'pennant' comes from the triangular flag shape of the consolidation zone. 'Bearish' indicates the pattern occurs during a downtrend and signals continuation lower. The preceding sharp move is called the 'flagpole.'
How It Forms
Formation Steps
- 1Sharp bearish impulse move forming the flagpole
- 2Converging trendlines creating a small symmetrical triangle (the pennant)
- 3Decreasing volume during the pennant consolidation
- 4Bearish breakout below the lower trendline with increasing volume
Prerequisites
- Strong bearish move preceding the pattern (the flagpole)
- The flagpole should drop at least 5-10% in a short period
- Volume should be high during the flagpole
Confirmation Signals
- Break below the lower trendline of the pennant
- Volume surge on the breakdown
- Close below the pennant's low
Invalidation Signals
- Break above the upper trendline of the pennant
- Consolidation lasting more than 3-4 weeks
- Increasing volume pushing price higher
Candle Breakdown
Flagpole Candles
A series of large bearish candles forming the sharp decline that precedes the pennant. Typically 3-7 candles with minimal upper wicks.
Aggressive selling creates panic as price drops rapidly. Fear drives volume higher.
Pennant Consolidation
A series of smaller candles forming higher lows and lower highs, creating converging trendlines. Volume diminishes progressively.
The market pauses as short-term sellers take profits and bargain hunters attempt to buy the dip. Neither side commits fully.
Breakdown Candle
A strong bearish candle that breaks below the lower trendline of the pennant, resuming the downtrend with conviction.
Sellers regain control, and any remaining bulls capitulate. The brief consolidation was just a pause, not a reversal.
Psychology
The bearish pennant represents a temporary equilibrium between profit-taking sellers and bargain-hunting buyers after a sharp decline. The declining volume during consolidation shows buyers lack conviction, and the eventual breakdown confirms seller dominance.
Buyer Perspective
Buyers attempt to bottom-fish during the consolidation, creating higher lows. However, their inability to push price through the upper trendline reveals weakening demand.
Seller Perspective
Sellers take partial profits during the consolidation but maintain their bearish thesis. The lower highs within the pennant confirm that selling pressure remains dominant.
Smart Money Action
Institutional traders use the pennant consolidation to add to short positions at better prices, knowing the pattern has a high probability of continuing lower.
Retail Trader Trap
Retail traders see the consolidation as a potential bottom and buy the dip, only to get trapped when the breakdown occurs.
Emotional Cycle
Trading Strategy
Aggressive Entry
Enter short when price touches the lower trendline of the pennant for the third time, anticipating the breakdown.
Conservative Entry
Wait for a close below the lower trendline of the pennant on increased volume, then enter on the next candle.
Measured move: flagpole length projected from the breakout point
Next major support level
150% of the flagpole length for extended moves
Best Conditions
- Timeframe: 1D
- Timeframe: 4h
- Timeframe: 1h
- Strong downtrends
- High volatility environments
- Panic selling markets
- Asset: Stocks
- Asset: Indices
- Asset: Crypto
Avoid When
- Timeframe: 1m
- Timeframe: 5m
- Low-volatility sideways markets
- Strong uptrends
Confluence Factors
- Flagpole breaks through a key support level
- Pennant forms below a broken support (now resistance)
- Moving averages sloping downward above the pennant
- Bearish MACD crossover during the consolidation
- Fibonacci retracement alignment with pennant boundaries
Scale In Strategy
Enter initial position on the breakdown and add on a pullback to the lower trendline if it holds as resistance.
Scale Out Strategy
Take 50% at the measured move target, trail the rest with a 21 EMA.
Risk Management
Volume Analysis
Volume Confirmation
Volume should decline during the pennant and spike on the breakdown. A volume increase of 50%+ on the breakdown candle is ideal.
Volume Profile
Low-volume consolidation followed by high-volume breakdown is the signature volume pattern for pennants.
Volume Divergence
Increasing volume during the pennant without a breakout suggests the pattern may fail.
Technical Confluence
Support Resistance
The pennant's lower trendline becomes the breakout level. The broken support often becomes resistance on retests.
Fibonacci Levels
The pennant consolidation typically retraces 23.6% to 38.2% of the flagpole. Deeper retracements suggest the pattern may fail.
Moving Averages
The 20 EMA often catches up to the pennant during consolidation and acts as dynamic resistance on the breakdown.
Rsi Confirmation
RSI below 50 during the pennant supports the bearish continuation thesis. RSI breaking below 40 on the breakdown adds confirmation.
Macd Confirmation
MACD should remain below the signal line during the pennant. A fresh bearish crossover on the breakdown is ideal.
Bollinger Bands
The Bollinger Bands squeeze during the pennant consolidation, and the breakdown occurs as price pierces the lower band.
Vwap
Price trading below VWAP throughout the pennant confirms bearish sentiment.
Ichimoku Cloud
The pennant forming below the Kumo cloud confirms the bearish environment for continuation.
Elliott Wave
Pennants often form as Wave 4 corrections within a bearish impulse, preceding the final Wave 5 decline.
Wyckoff Phase
The pennant can represent a minor redistribution phase within a larger markdown.
Market Profile
The pennant forms at or below the value area low, suggesting sellers maintain control.
Order Flow
Passive sell orders at the upper trendline of the pennant create resistance that eventually breaks to the downside.
Open Interest
Monitor open interest changes for additional confirmation of institutional participation in the move.
Multi-Timeframe Analysis
Higher Timeframe Alignment
A daily pennant is strongest when the weekly trend is clearly bearish with price below key moving averages.
Lower Timeframe Entry
Use the 1H chart to time the breakdown entry from a 4H or daily pennant—look for a lower-timeframe bearish signal as price approaches the lower trendline.
Timeframe Confluence
A 4H pennant within a daily downtrend, confirmed by a weekly bearish structure, provides the highest probability continuation setup.
Top-Down Approach
Confirm the weekly downtrend, identify the daily pennant, and use the 4H or 1H chart for precise entry timing.
Statistics
Historical Examples
Tesla Bearish Pennant 2022
successTesla formed a textbook bearish pennant after a sharp 25% drop. The pennant consolidated for 8 days before breaking down, leading to another 30% decline.
Lesson: In high-momentum stocks, bearish pennants during broader market sell-offs can lead to massive continuation moves.
Bitcoin Bearish Pennant at $40,000
successBTC formed a bearish pennant at $40,000 after a sharp decline from $43,000. The breakdown targeted $35,000 and price reached $33,000.
Lesson: Crypto bearish pennants often overshoot their measured move targets during fear-driven markets.
Variations
Micro Pennant
A very small pennant that forms over just 3-5 candles, often seen on intraday charts during fast-moving sell-offs.
Pennant with Gap Breakdown
The breakdown from the pennant occurs with a gap down, adding conviction to the continuation signal.
Confusion Matrix
Patterns commonly confused with Bearish Pennant and how to distinguish them.
Bearish Flag
8000% similarDraw the trendlines of the consolidation. If they converge to a point, it is a pennant. If they are roughly parallel, it is a flag.
Key Differences
- Flags have parallel trendlines; pennants have converging trendlines
- Pennants are symmetrical triangles; flags are rectangular channels
- Pennants typically consolidate for a shorter period than flags
Bearish Descending Triangle
5500% similarA pennant has both higher lows and lower highs (symmetrical). A descending triangle has equal lows (flat bottom) and lower highs.
Key Differences
- Descending triangles have a flat bottom and descending top; pennants are symmetrical
- Pennants require a flagpole (sharp prior move); descending triangles do not
- Pennants form more quickly than descending triangles
The Descending Triangle is a bearish continuation pattern featuring a flat support level with lower highs converging into an apex, typically resolving with a breakdown below the horizontal support as sellers gradually overwhelm buyers.
The bearish flag is a continuation pattern consisting of a sharp decline (flagpole) followed by a gentle upward-sloping consolidation (flag) before price breaks down to continue the trend.
The Bullish Pennant is a continuation pattern featuring a sharp advance (flagpole) followed by a brief triangular consolidation (pennant), before price breaks out and continues higher with a measured move equal to the flagpole.
The Broadening Top (Megaphone) is a chart formation characterized by expanding price swings that create higher highs and lower lows, reflecting increasing volatility and instability at market tops before a bearish breakdown.
The Descending Channel is a chart formation where price trends lower within two parallel downward-sloping trendlines, making consistent lower highs and lower lows in an orderly bearish progression.
The Diamond Top is a rare reversal pattern that forms at market peaks, consisting of a broadening formation followed by a contracting formation, creating a diamond shape that signals a shift from expansion to contraction and ultimately a bearish breakdown.
Pro Tips & Common Mistakes
Pro Tips
- The best bearish pennants consolidate for 1-3 weeks on daily charts—shorter is generally better.
- Volume should dry up to at least 50% below average during the pennant before the breakdown.
- The steeper and longer the flagpole, the more reliable the continuation signal.
- Set alerts at the lower trendline rather than watching constantly—pennant breakdowns can be sudden.
- If the pennant lasts longer than 3-4 weeks, it may be transitioning into a larger symmetrical triangle.
Common Mistakes
- Confusing a pennant with a flag—check if the trendlines converge or are parallel
- Trading pennants without a clear flagpole—the sharp prior move is essential
- Entering before the breakdown is confirmed—patience prevents false breakout losses
- Not using the measured move target for profit-taking
- Trading bearish pennants in strong uptrends (counter-trend pennants have lower success rates)
Advanced Techniques
- Use the pennant's apex (convergence point) as a time target—breakdowns typically occur before price reaches the apex.
- Measure the flagpole from the start of the sharp move to the highest point of the pennant for the most accurate measured move.
- Combine the pennant with Elliott Wave analysis—they often appear as Wave 4 consolidations before the final Wave 5.
- In options trading, the low implied volatility during the pennant consolidation makes buying puts relatively cheap.
Institutional Perspective
Institutional traders view pennant consolidations as opportunities to add to short positions. The declining volume and tight range allow them to accumulate short positions without moving the market. When the breakdown occurs, the concentrated institutional selling creates the characteristic high-volume continuation.
Fun Facts
- Bearish pennants are sometimes called 'half-mast' patterns because they tend to form at the halfway point of the overall move.
- In the 2020 COVID crash, multiple major indices formed intraday bearish pennants that resolved within minutes, showcasing the pattern's fractal nature.
- Research shows that bearish pennants with flagpole declines exceeding 10% have a higher completion rate than those with smaller flagpoles.
Frequently Asked Questions
A bearish pennant is a continuation pattern consisting of a sharp decline (the flagpole) followed by a small symmetrical triangle consolidation (the pennant). It signals that the downtrend is likely to continue after the brief pause.
Measure the length of the flagpole (from the start of the sharp decline to the beginning of the pennant) and project that distance downward from the breakout point of the pennant.
A bearish pennant has converging trendlines forming a small symmetrical triangle, while a bearish flag has roughly parallel trendlines forming a rectangular channel. Both are continuation patterns with similar measured move targets.