Overview
Bearish H&S Neckline Retest
Also known as: Head and Shoulders Throwback, Neckline Pullback, H&S Retest Entry
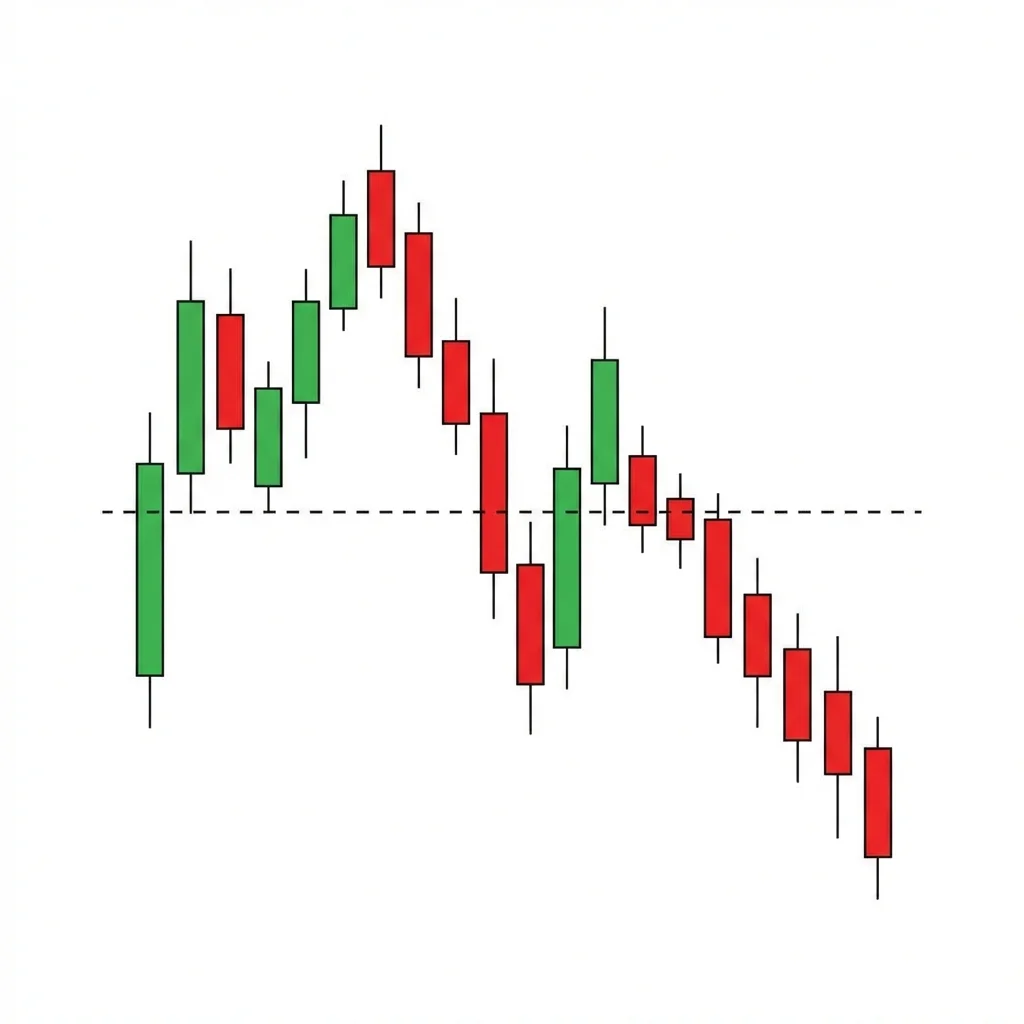
The H&S neckline retest occurs when price pulls back to retest the broken neckline from below (throwback), gets rejected, and continues the measured move decline. It provides a second entry opportunity for traders who missed the original breakdown.
After a head and shoulders pattern breaks its neckline, approximately 65% of the time price will rally back to retest the neckline from below before continuing the decline. This throwback is a gift for traders — it provides a second chance to enter short with a clearly defined risk level (above the neckline). The key is to look for rejection at the neckline: the old support has become new resistance. Volume should be light on the throwback and expand on the rejection, confirming that the rally is just a correction within the new downtrend.
History & Etymology
The neckline retest concept was formally documented by Edwards and Magee in 'Technical Analysis of Stock Trends' and later quantified by Thomas Bulkowski. Bulkowski's research found that throwbacks occur in approximately 65-68% of head and shoulders breakdowns.
The 'throwback' terminology comes from the idea that price is 'thrown back' to the broken level like a ball bouncing. The neckline retest is simply the market's way of confirming that the old support is now functioning as resistance.
How It Forms
Formation Steps
- 1Completed head and shoulders pattern with neckline break
- 2Price declines below the neckline on volume
- 3Price rallies back up to retest the neckline from below (throwback)
- 4Rejection candle forms at or near the neckline
- 5Price resumes the decline
Prerequisites
- Completed head and shoulders breakdown
- Neckline has been broken with conviction
Confirmation Signals
- Bearish rejection candle at the neckline
- Volume decreases on the throwback and increases on the rejection
- RSI fails to reach overbought on the throwback
Invalidation Signals
- Price closes above the neckline and sustains above for multiple sessions
- Strong volume carries price back above the neckline
- Right shoulder high is exceeded
Candle Breakdown
Breakdown Candle(s)
Strong bearish candle(s) breaking below the neckline with increased volume.
The initial breakdown triggers panic and stop-loss selling. This is the primary signal.
Throwback Candle(s)
Weaker bullish candles rallying back toward the neckline on diminishing volume.
Short-covering and bargain hunting drive a weak rally. Volume declining confirms this is corrective, not impulsive.
Rejection Candle
A bearish candle that rejects off the neckline from below, confirming resistance and the continuation of the decline.
Sellers defend the neckline aggressively. Trapped throwback buyers capitulate, fueling the next leg down.
Psychology
The throwback represents the market's final test of the broken neckline. Bulls make one last attempt to reclaim the level, but the failure confirms the reversal and demoralizes remaining buyers.
Buyer Perspective
Buyers see the throwback as a recovery opportunity and buy the dip. The rejection at the neckline traps them and confirms that the support they relied on is gone.
Seller Perspective
Smart sellers use the throwback as a second entry point. The neckline provides a clear resistance level with defined risk, making it an optimal short entry.
Smart Money Action
Institutions who missed the initial breakdown use the throwback to establish or add to short positions. They may even allow the throwback to occur by briefly pausing their selling.
Retail Trader Trap
Retail traders buy the throwback believing the H&S has failed. The neckline rejection traps them with losses and their stops fuel the next leg of the decline.
Emotional Cycle
Trading Strategy
Aggressive Entry
Short as soon as price touches the neckline from below, anticipating the rejection.
Conservative Entry
Wait for a clear rejection candle at the neckline, then enter short on the next candle's break below the rejection candle's low.
Retest of the post-breakdown low.
Original measured move target (head to neckline distance projected down).
1.5x the measured move.
Best Conditions
- Timeframe: daily
- Timeframe: 4h
- Timeframe: weekly
- post-H&S breakdown
- bear market
- sector weakness
- Asset: stocks
- Asset: indices
- Asset: forex
- Asset: crypto
Avoid When
- Timeframe: 1m
- Timeframe: 5m
- V-bottom reversal
- strong bull market recovery
Confluence Factors
- Neckline aligns with a moving average (50 or 200 SMA)
- RSI fails to reach 60 on the throwback
- MACD remains negative during the throwback
- Neckline is at a psychologically significant price
- Sector or market trend supports the bearish setup
Scale In Strategy
Enter 50% on the rejection, add 50% when the post-breakdown low is broken.
Scale Out Strategy
Take 33% at the post-breakdown low, 33% at the measured move, trail remaining.
Risk Management
Volume Analysis
Volume Confirmation
Volume should decline on the throwback and expand on the rejection. This is the critical volume signature.
Volume Profile
The neckline area should show a high-volume node from the original H&S formation. The rejection occurs as price enters this area from below.
Volume Divergence
If volume increases on the throwback, be cautious — the neckline may be reclaimed.
Technical Confluence
Support Resistance
The neckline is the key level — old support turned resistance. This polarity concept is the foundation of the trade.
Fibonacci Levels
The throwback often retraces 38.2-61.8% of the initial breakdown leg. The neckline itself may align with a Fibonacci level.
Moving Averages
If the neckline coincides with the 50 or 200 SMA, the resistance is significantly stronger.
Rsi Confirmation
RSI should stay below 50-60 during the throwback. Reaching above 60 suggests the neckline may be reclaimed.
Macd Confirmation
MACD should remain in negative territory during the throwback. A bearish crossover at the neckline confirms rejection.
Bollinger Bands
The throwback often reaches the middle Bollinger Band (20 SMA) which may coincide with the neckline.
Vwap
Anchored VWAP from the head often aligns with the neckline, providing additional resistance.
Ichimoku Cloud
Neckline within or at the bottom of the Kumo cloud creates a powerful resistance zone.
Elliott Wave
The throwback often represents a corrective Wave 2 or Wave B within the new impulsive decline.
Wyckoff Phase
The throwback is the 'last point of supply' (LPSY) or the 'back-up to the creek' in Wyckoff terminology.
Market Profile
The neckline area represents the value area high of the new downtrend. The throwback tests this boundary.
Order Flow
Passive selling accumulates at the neckline. The throwback buying is absorbed by these resting sell orders.
Open Interest
Put open interest clustering at the neckline level confirms institutional bearish positioning.
Multi-Timeframe Analysis
Higher Timeframe Alignment
A weekly H&S neckline retest is an extremely powerful short setup, potentially signaling months of decline.
Lower Timeframe Entry
Use the 4H or 1H chart to identify the exact rejection pattern at the neckline for optimal entry timing.
Timeframe Confluence
The neckline should be identifiable on multiple timeframes. A daily neckline retest that aligns with a 4H resistance zone is ideal.
Top-Down Approach
Weekly H&S confirmed → Daily neckline throwback → 4H rejection pattern → 1H short entry.
Statistics
Historical Examples
S&P 500 Neckline Retest 2022
successAfter breaking the neckline of an H&S pattern in June 2022, the S&P 500 rallied back to retest the neckline during the August bear market rally. The rejection at the neckline led to new lows in October.
Lesson: Bear market rallies that reach H&S necklines provide excellent short entries. The emotional relief rally creates the perfect trap.
EUR/USD Neckline Throwback
successEUR/USD formed an H&S pattern on the daily chart and broke the neckline. A two-week throwback to the neckline was rejected, leading to a continuation toward parity.
Lesson: Forex neckline retests are very reliable and often provide textbook entries with clean rejection candles.
Variations
Quick Throwback
Throwback completes within 1-3 candles, showing weak buying.
Extended Throwback
Throwback takes 10+ candles and nearly reclaims the neckline.
Gap Rejection Throwback
The throwback reaches the neckline and is rejected with a gap down.
Confusion Matrix
Patterns commonly confused with Bearish H&S Neckline Retest and how to distinguish them.
Bearish Last Kiss
80% similarIf the retest occurs at the neckline of a head and shoulders pattern, it is an H&S neckline retest. If it is a retest of any other broken support level, it is a last kiss.
Key Differences
- Neckline retest specifically follows an H&S pattern
- Last kiss refers to any broken support retest
- Neckline retest has the H&S measured move as target
Bearish Resistance Rejection
60% similarCheck whether the resistance level being retested is the neckline of a head and shoulders pattern. If yes, it is a neckline retest. Otherwise, it is a general resistance rejection.
Key Differences
- Neckline retest is a specific case of resistance rejection
- The neckline provides a unique context (H&S pattern)
- Neckline retests have a defined measured move target
The head and shoulders is the most well-known reversal pattern in technical analysis. It consists of three peaks — a higher middle peak (head) flanked by two lower peaks (shoulders) — and signals a major bearish reversal when the neckline breaks.
The last kiss occurs when price breaks below support, rallies back to 'kiss' the broken level from below, and is rejected. The old support now acts as resistance, confirming the breakdown and offering an optimal short entry.
A bearish resistance rejection occurs when price rallies into a well-established resistance level and is met with selling pressure, producing bearish candles with long upper wicks. The repeated failure to break through resistance signals a reversal.
The Broadening Top (Megaphone) is a chart formation characterized by expanding price swings that create higher highs and lower lows, reflecting increasing volatility and instability at market tops before a bearish breakdown.
The Descending Channel is a chart formation where price trends lower within two parallel downward-sloping trendlines, making consistent lower highs and lower lows in an orderly bearish progression.
The Descending Triangle is a bearish continuation pattern featuring a flat support level with lower highs converging into an apex, typically resolving with a breakdown below the horizontal support as sellers gradually overwhelm buyers.
Pro Tips & Common Mistakes
Pro Tips
- The neckline retest provides the single best risk-reward entry in the entire H&S sequence — many professional traders only enter H&S trades on the throwback.
- About 65% of H&S breakdowns produce a throwback, so be patient and wait for it.
- The throwback should be on declining volume. If volume increases on the throwback, the neckline may be reclaimed.
- Use a lower timeframe rejection pattern at the neckline for precise entry timing.
Common Mistakes
- Waiting too long for the throwback — 35% of H&S breakdowns continue without a retest.
- Entering the throwback long, expecting the H&S to fail — the neckline is resistance now.
- Not using the neckline as a clear stop level — it is the perfect invalidation point.
- Panic-selling on the initial throwback rally, thinking the H&S has failed.
Advanced Techniques
- Use volume profile to identify exactly where within the neckline zone the highest volume was traded — this is the strongest resistance.
- Combine with options flow: increasing put-call ratio at the neckline confirms institutional bearish conviction.
- Monitor the throwback's internal structure on lower timeframes for specific rejection patterns (shooting star, evening star).
- Use time analysis: throwbacks that take less than 5 days are more likely to fail and resume the decline quickly.
Institutional Perspective
Professional traders consider the neckline retest to be the 'textbook' entry for H&S trades. The defined risk (above neckline), clear target (measured move), and high win rate make it ideal for institutional position building.
Fun Facts
- Thomas Bulkowski's research found that head and shoulders patterns WITH a throwback actually had slightly better subsequent performance than those WITHOUT a throwback.
- The 65% throwback rate has been remarkably consistent across different markets and time periods, making it one of the most reliable statistics in technical analysis.
- Some institutional trading desks specifically program algorithms to enter short on H&S neckline retests, as the setup has the best risk-reward profile in the entire H&S sequence.
Frequently Asked Questions
A neckline retest (throwback) occurs when price rallies back to the broken neckline of a head and shoulders pattern from below. The neckline, which was formerly support, acts as resistance and rejects the rally.
Research shows that approximately 65% of head and shoulders breakdowns produce a neckline retest. The remaining 35% continue declining without a throwback.
The retest entry offers better risk-reward because the stop is tighter (above the neckline). However, you risk missing the trade entirely if no throwback occurs. Many traders use a split approach — enter partial on breakdown and add on retest.