Loading patterns...
Single Candle Patterns
Patterns formed by a single candlestick that signal potential market direction changes.
29 patterns
Single candlestick patterns are the building blocks of all candlestick analysis. These patterns form within a single trading period and provide immediate insight into the battle between buyers and sellers. While they are the simplest patterns to identify, they require strong contextual awareness — a single candle pattern at a key support or resistance level carries far more weight than one appearing in the middle of a range. Mastering single candle patterns is essential before moving to more complex multi-candle formations.
Showing 29 of 29 patterns
bearishreversal1 candle
Bearish Belt Hold
Yorikiri
The Bearish Belt Hold is a single bearish candle that opens at its high and closes near its low with a long body, indicating that sellers dominated from the opening bell and controlled price action throughout the session.
Diff
Rel
bearishboth1 candle
Bearish Closing Marubozu
Marubozu Owari
The Bearish Closing Marubozu is a single bearish candle with no lower shadow — the close is at the exact low of the session. This indicates that sellers controlled the session and maintained pressure through the very last trade, a sign of strong bearish conviction.
Diff
Rel
bearishreversal1 candle
Bearish Gravestone Doji
Hakaishi
The gravestone doji is a single-candle reversal pattern with the open, close, and low at the same level and a long upper shadow, resembling a gravestone. It signals that buyers pushed price higher but sellers reclaimed all gains by the close.
Diff
Rel
bearishreversal1 candle
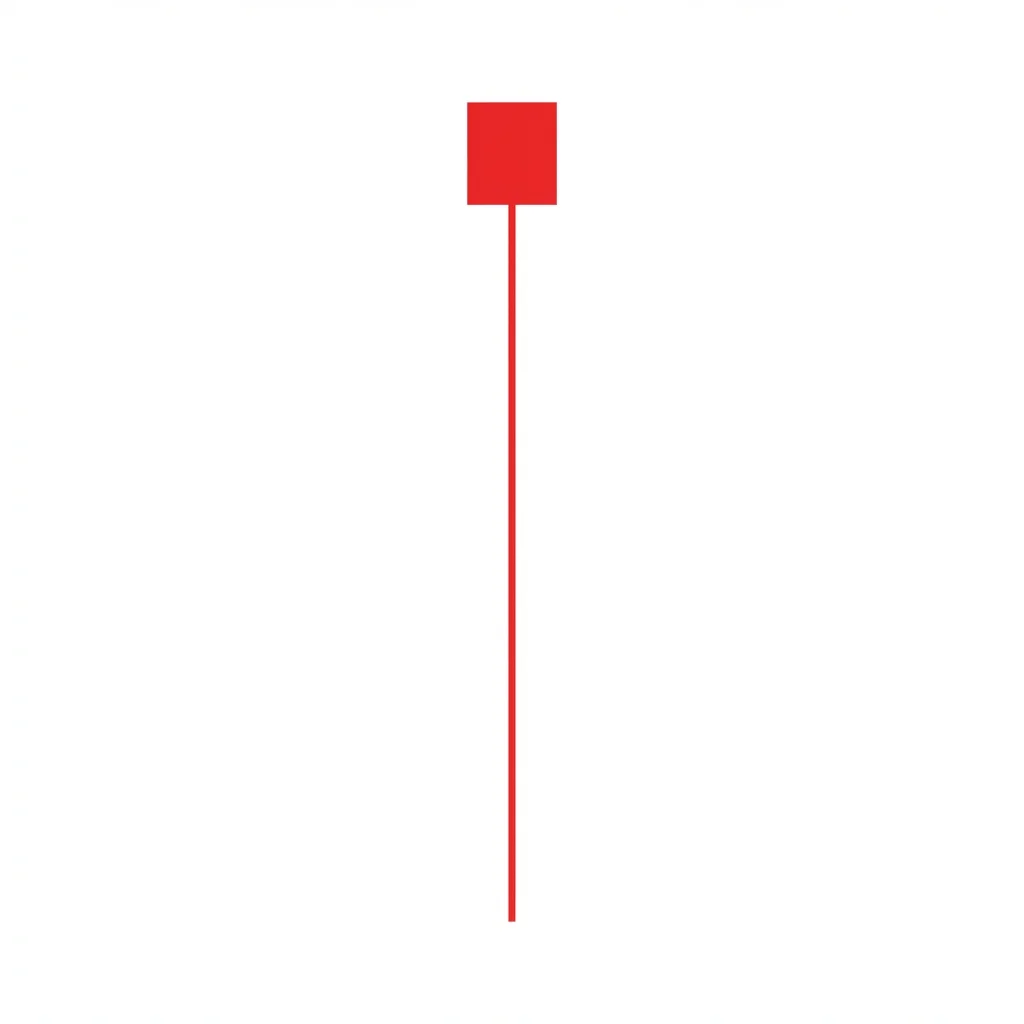
Bearish Hanging Man
Kubitsuri
The hanging man is a single-candle bearish reversal pattern with a small body at the top and a long lower shadow, appearing at the top of an uptrend. It warns that selling pressure is emerging despite the continued uptrend.
Diff
Rel
bearishreversal1 candle
Bearish Key Reversal
The bearish key reversal is a powerful single-bar reversal pattern where price makes a new high then reverses to close below the prior bar's low on high volume, signaling a decisive shift from buying to selling control.
Diff
Rel
bearishreversal1 candle
Bearish Long Upper Shadow
A candle with a long upper shadow (at least 2-3x the body) indicates that price rallied significantly during the session but was rejected, closing near the low. It signals selling pressure and potential reversal at the top of rallies.
Diff
Rel
bearishcontinuation1 candle
Bearish Marubozu
Marubozu
The bearish marubozu is a single candle with no shadows — price opened at the high and closed at the low, showing complete seller domination throughout the entire session with no buying resistance.
Diff
Rel
bearishcontinuation1 candle
Bearish Opening Marubozu
Yoritsuki Marubozu
The bearish opening marubozu is a single candle where the open equals the high (no upper shadow), showing that sellers took immediate control at the open and maintained pressure throughout the session. A small lower shadow may be present.
Diff
Rel
bearishreversal1 candle
Bearish Shooting Star
Nagare Boshi
The shooting star is a single-candle bearish reversal pattern with a small body near the low and a long upper shadow. It shows that buyers pushed price significantly higher during the session but sellers drove it back down, signaling a potential top.
Diff
Rel
bullishreversal1 candle
Bullish Belt Hold
Yorikiri
The Bullish Belt Hold is a single-candle reversal pattern that opens at the low of the session and rallies strongly to close near the high, signaling a potential shift from bearish to bullish control.
Diff
Rel
bullishcontinuation1 candle
Bullish Closing Marubozu
Marubozu
The Bullish Closing Marubozu is a single-candle pattern where the close equals the session high (no upper shadow), signaling that buyers maintained control through the closing bell with zero pullback.
Diff
Rel
bullishreversal1 candle
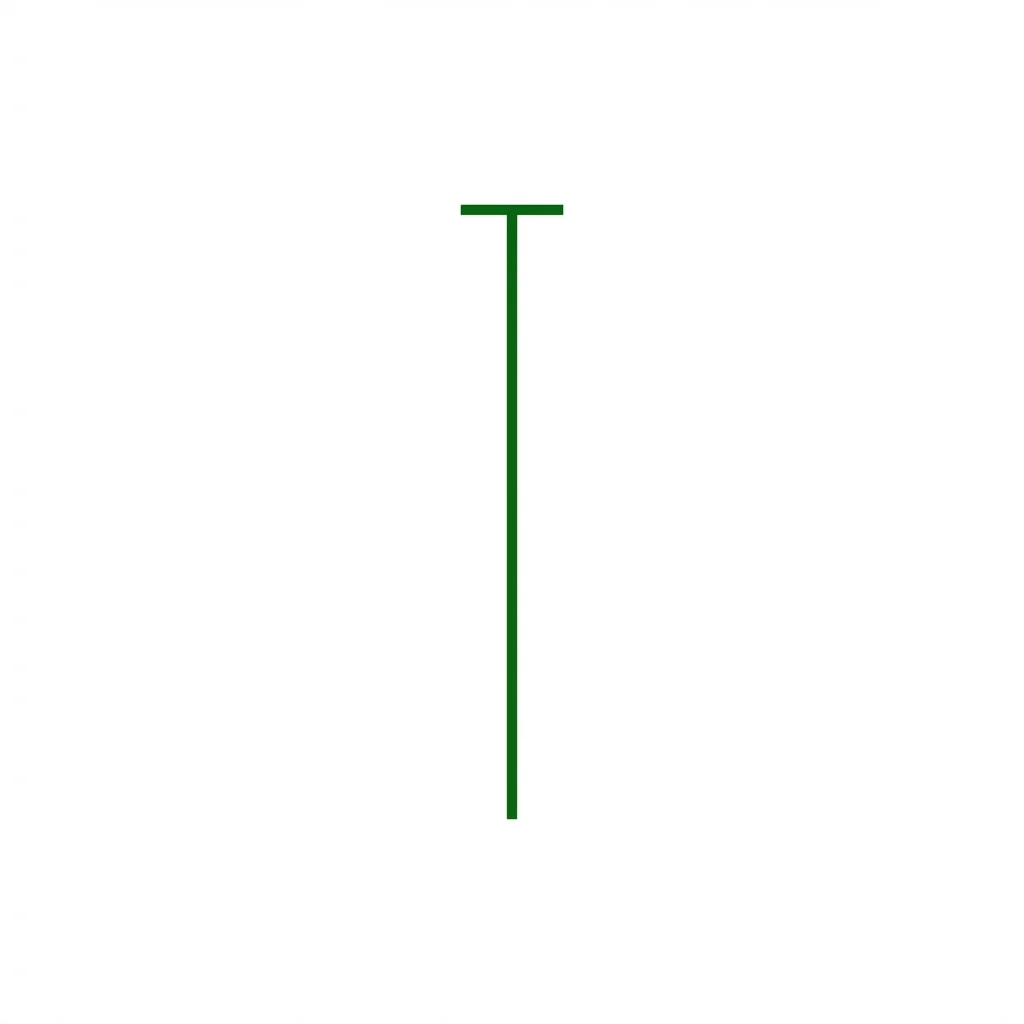
Bullish Dragonfly Doji
Tonbo
The Dragonfly Doji is a powerful single-candle reversal signal where sellers push price significantly lower during the session, but buyers fight back to close at the opening level, creating a T-shaped candle that signals complete rejection of lower prices.
Diff
Rel
bullishreversal1 candle
Bullish Inverted Hammer
Tohba (倒バ)
The Inverted Hammer is a single-candle bullish reversal pattern appearing at the bottom of downtrends. Its long upper shadow shows buyers attempted to push price higher, hinting that the selling pressure may be ending.
Diff
Rel
bullishreversal1 candle
Bullish Key Reversal
A Bullish Key Reversal occurs when price makes a new low during a downtrend but reverses to close above the prior bar's high on heavy volume, signaling a dramatic single-day shift in control from sellers to buyers.
Diff
Rel
bullishreversal1 candle
Bullish Long Lower Shadow
A candle with a long lower shadow signals that buyers aggressively rejected lower prices during the session, pushing price back up from the lows. This buying pressure suggests a potential bottom or support level.
Diff
Rel
bullishcontinuation1 candle
Bullish Marubozu
Marubozu (丸坊主)
The Bullish Marubozu is a single candle with no shadows — it opens at the low and closes at the high, representing complete buyer dominance throughout the entire session with no seller resistance.
Diff
Rel

bullishcontinuation1 candle
Bullish Opening Marubozu
Yoritsuki Marubozu
The Opening Marubozu is a bullish candle with no lower shadow — the open IS the low — showing that from the moment the session opened, buyers were in control and never let price trade below the open.
Diff
Rel
bullishreversal1 candle
Bullish Takuri
Takuri (探り)
The Bullish Takuri is a single-candle reversal pattern characterized by an extremely long lower shadow and a tiny body near the candle's high. It is a stronger version of the hammer, indicating aggressive rejection of lower prices and a high probability of trend reversal.
Diff
Rel
neutralindecision1 candle
Doji
Doji (同事)
The Doji is the quintessential indecision candle where opening and closing prices are virtually identical, reflecting a perfect tug-of-war between buyers and sellers.
Diff
Rel

neutralindecision1 candle
Four-Price Doji
The Four-Price Doji is the rarest doji variant where all four price points (open, high, low, close) are identical, appearing as a horizontal line and signaling complete market inactivity or perfect equilibrium.
Diff
Rel
neutralindecision1 candle
Hammer Doji
Tonbo (トンボ)
The Hammer Doji (Dragonfly Doji) features a long lower shadow with the open and close at the session high, showing that sellers drove price down sharply but buyers recovered all losses, creating a neutral signal that depends on context.
Diff
Rel
neutralindecision1 candle
High Wave
Takuri (たくり)
The High Wave candle features a small body with extremely long upper and lower shadows, signaling intense intraday volatility and extreme indecision that often precedes a significant directional move.
Diff
Rel
neutralindecision1 candle
Long-Legged Doji
Juji (十字)
The Long-Legged Doji features extremely long shadows in both directions with the open and close near the center, representing the most extreme form of single-candle indecision and a potent warning of momentum exhaustion.
Diff
Rel
neutralindecision1 candle
Northern Doji
The Northern Doji appears after an uptrend and signals that buying momentum may be exhausting. While it warns of potential reversal, it can also be a pause before continuation, making it a neutral alert rather than a directional signal.
Diff
Rel
neutralindecision1 candle
Paper Umbrella
Karakasa (唐傘)
The Paper Umbrella is a context-neutral candle with a small body at the top and a long lower shadow. It becomes a Hammer in downtrends (bullish) or a Hanging Man in uptrends (bearish), but without trend context it is a neutral indecision signal.
Diff
Rel
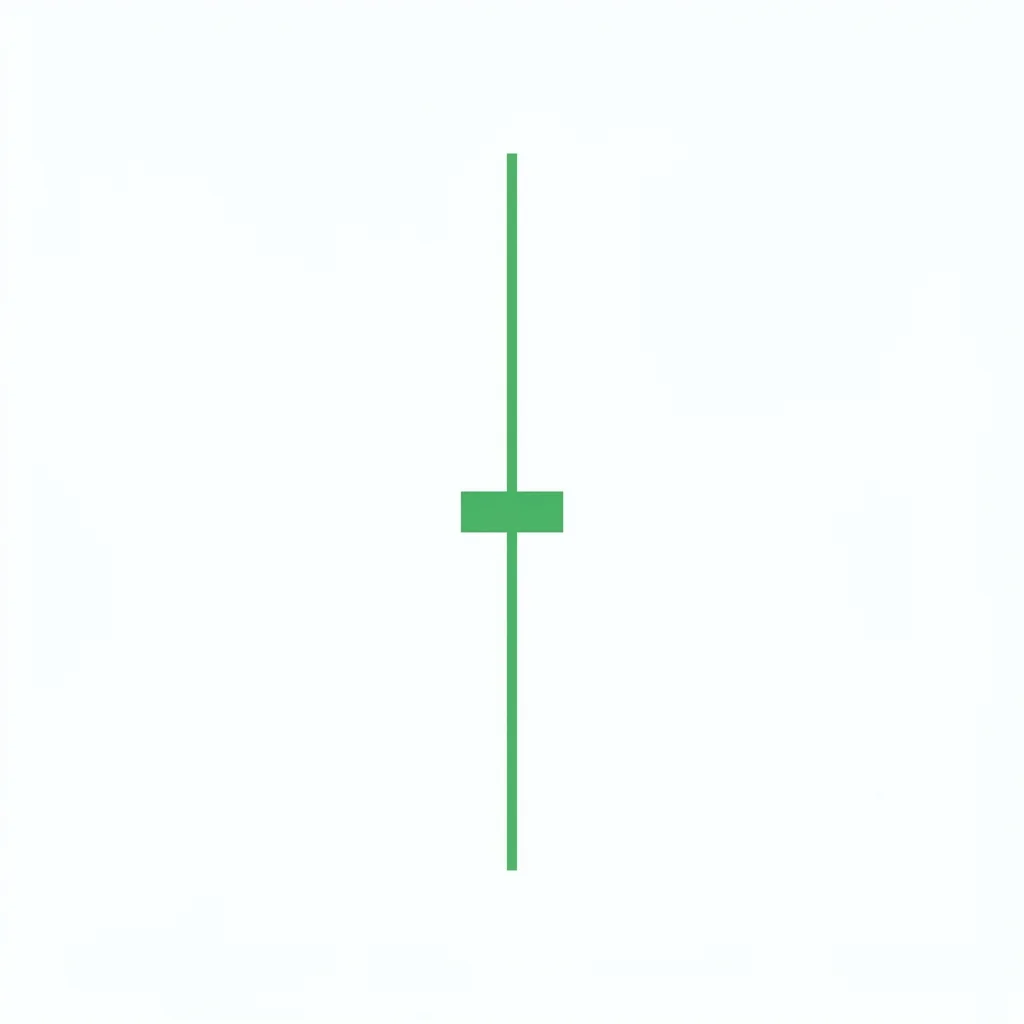
neutralindecision1 candle
Rickshaw Man
Jinrikisha (人力車)
The Rickshaw Man is a specialized long-legged doji where the open and close are positioned exactly at the midpoint of the candle's range, representing the purest expression of market indecision with perfectly balanced shadows.
Diff
Rel
neutralindecision1 candle
Shooting Star Doji
Tohba (塔婆)
The Shooting Star Doji (Gravestone Doji) features a long upper shadow with the open and close at the session low, showing buyers drove prices up but sellers reversed all gains, creating a context-dependent signal that leans bearish in uptrends.
Diff
Rel
neutralindecision1 candle
Southern Doji
The Southern Doji appears after a downtrend and signals that selling momentum may be exhausting. While it warns of potential reversal, it can also be a pause before continuation lower, making it a neutral alert requiring confirmation.
Diff
Rel
neutralindecision1 candle
Spinning Top
Koma (独楽)
The Spinning Top is one of the most common candlestick patterns, featuring a small real body with shadows on both sides, indicating mild to moderate indecision where neither buyers nor sellers gained meaningful ground.
Diff
Rel
Frequently Asked Questions
Single candlestick patterns are chart patterns that form within one trading period (one candle). They include patterns like Doji, Hammer, Marubozu, and Shooting Star, each providing clues about market sentiment and potential direction.
Single candle patterns are most reliable when they appear at key support/resistance levels, with above-average volume, and in the context of an existing trend. Alone, they should be used as alerts rather than standalone trade signals.